
Fig. 2.
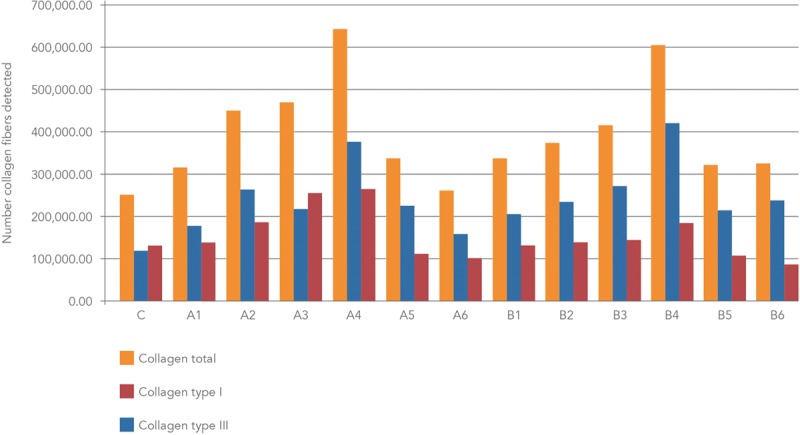
Mean numbers of collagen fibers detected after staining histologic sections with picrosirius red and observing under polarized light microscopy. C, control. A, CaHA treatment only. B, CaHA followed by microfocused ultrasound. Dilutions: A1, B1 (1:0.16), A2, B2 (1:0.3), A3, B3 (1:0.6), A4, B4 (1:1), A5, B5 (1:2), A6, B6 (1:6.5).