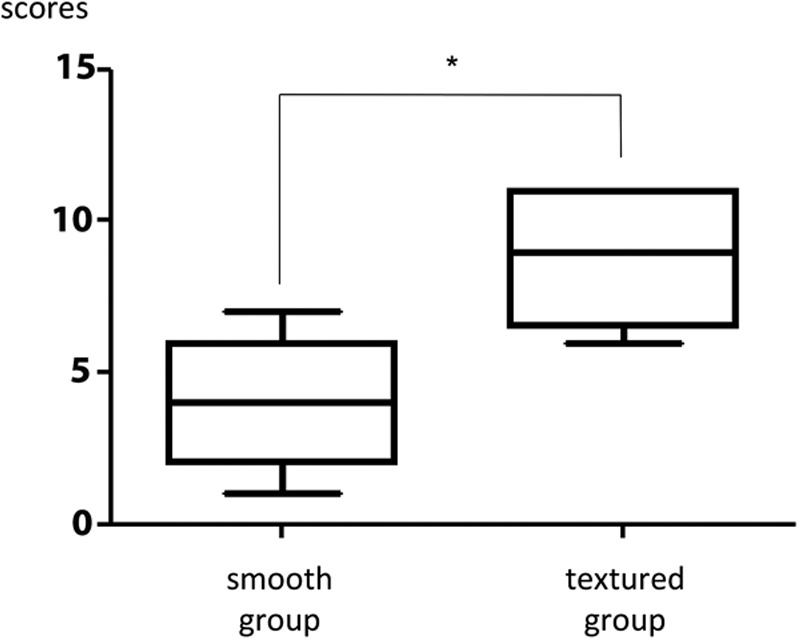
Fig. 4.

Comparison of the scores assessing the collagen fiber characteristics. Scores were significantly higher in the textured group than in the smooth group, demonstrating that the structure was closer to that of normal collagen fibers in the textured group. The results are expressed as mean ± SD (n = 5, 5); *P = 0.028 < 0.05 (Mann–Whitney U test).
