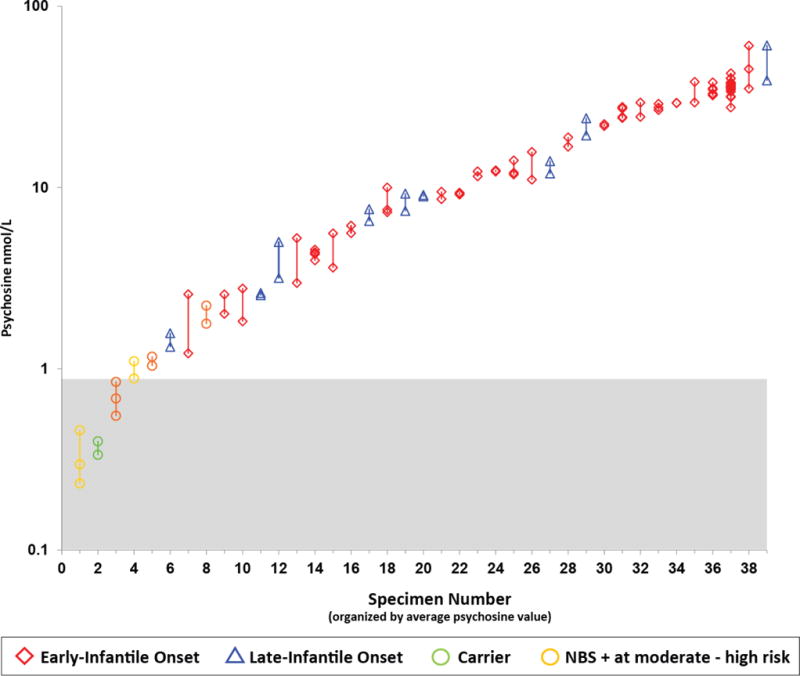
Fig. 1.

Within-specimen variability in DBS psychosine concentrations. Psychosine concentrations were plotted on a log scale for each DBS specimen, each of which was tested 2–20 times. Vertical lines connect replicates from the same specimen. The red diamonds represent EIKD patients; blue triangles represent LIKD patients; green circles represent sibling carriers; gold circles represent newborn screen-positive (NBS+) patients classified as moderate to high risk of developing KD. Each test was carried out using a separate 3-mm punch from the same DBS or from multiple DBS from the same bleed.
