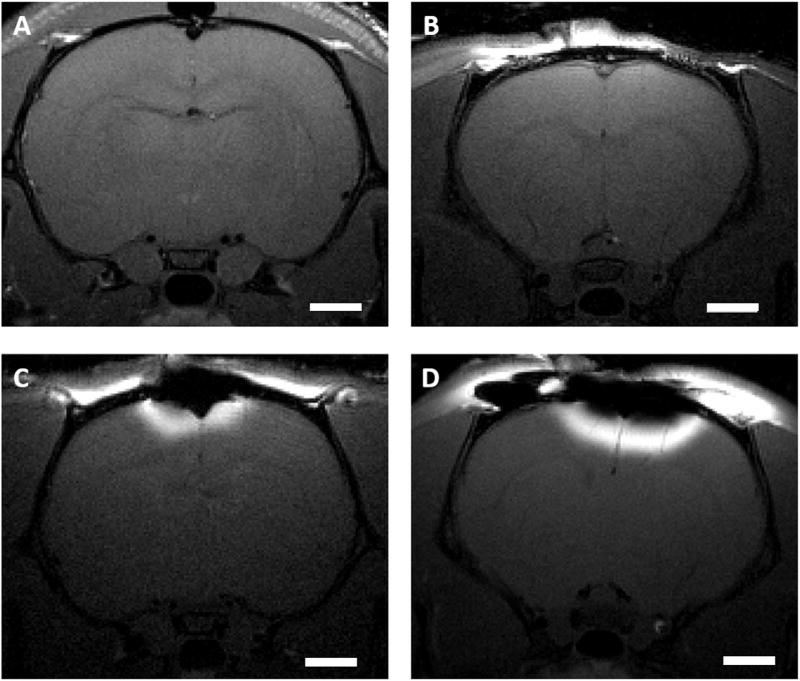
Fig. 2. Concentration dependence of transcranial manganese delivery efficiency.
T1 - weighted MR images of rats receiving - (A) control solution (slice shown is approximately −2.5 mm posterior from bregma), (B) 100 mM MnCl2 (slice shown is approximately 1.5 mm anterior from bregma), (C) 250 mM MnCl2 (slice shown is approximately −0.5 mm posterior from bregma), and (D) 500 mM MnCl2 (slice shown is approximately −0.5 mm posterior from bregma) on the bregma. Scale bar, 2 mm. Images are representative of three rats per group.

