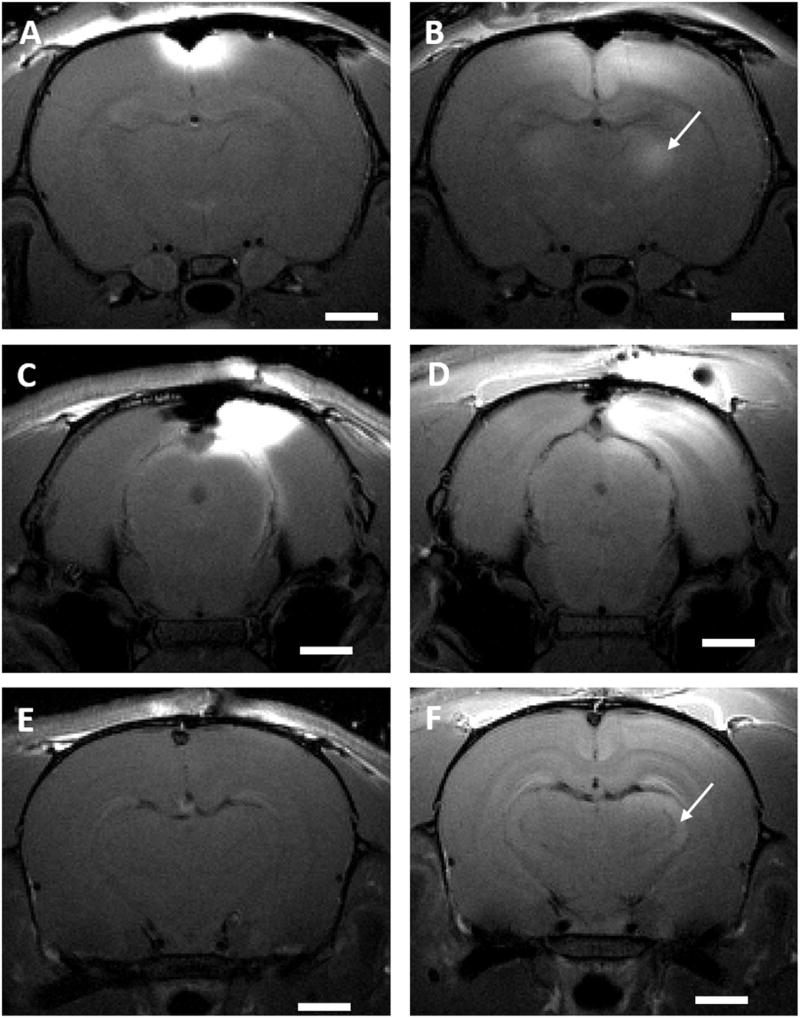
Fig. 5. Neuronal tract tracing with transcranially delivered manganese.
T1 - weighted MR images of rats receiving: 500 mM solution of MnCl2 on the bregma immediately after solution application (A), as well as of 24 h after administration (B), solution of 250 mM MnCl2 and 250 mM CaCl2 on the lambda immediately after solution application (C), (E) ((C) and (E) represent two different slices) as well as of 24 h after administration (D), (F). Scale bar, 2 mm. The white arrows indicate the location of thalamic nuclei to which manganese has traced 24 h after application. Images are representative of three rats per group.

