
Figure 1. Distinct transcriptional profiles of ex vivo sorted monocyte subsets.
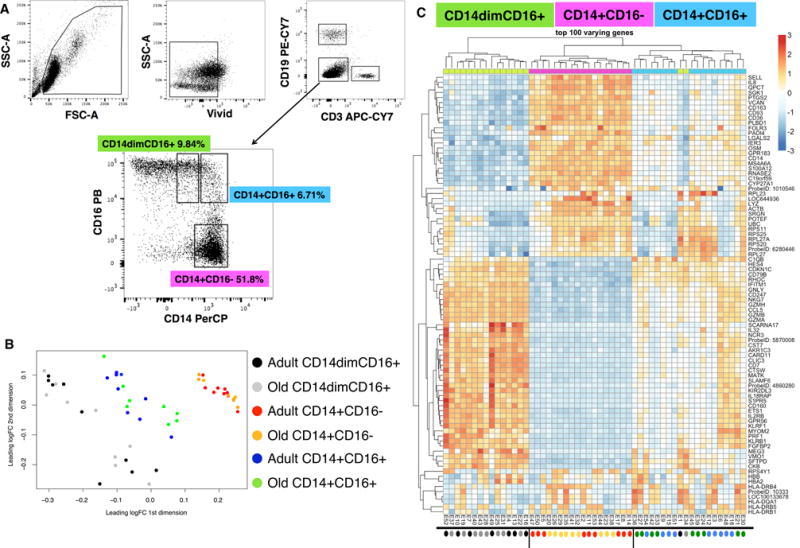
(A) Flow cytometry gating scheme used to sort CD14dimCD16+, CD14+CD16+, and CD14+CD16− monocyte subsets. (B) Multidimensional scaling plot (MDS) analysis was used to visualize the relationship amongst the three subsets using the relative expression of more than 18,000 transcripts. Each point represents a sample from one subset indicated by color (CD14+CD16− (red/yellow), CD14+CD16+ (blue/green), and CD14dimCD16+ (black/grey) from adult or old subjects (n = 9 per age group). The relative proximity of the samples along the X- and Y-axis reflect the principle components that separate the datasets based on gene expression intensities. (C) Hierarchical clustering analysis heat map of the top 100-discriminant genes (listed on the right) for each monocyte (CD14dimCD16+ (green), CD14+CD16− (purple), and CD14+CD16+ (blue) dataset (age groups were combined for each dataset). Scale is provided. Red denotes increased gene expression and blue denotes decreased gene expression. The colored circles under the heat map correspond to colors used in the MDS plot to indicate adults and old subjects.