
Figure 2. Differential expressed genes of ex vivo monocyte subsets.
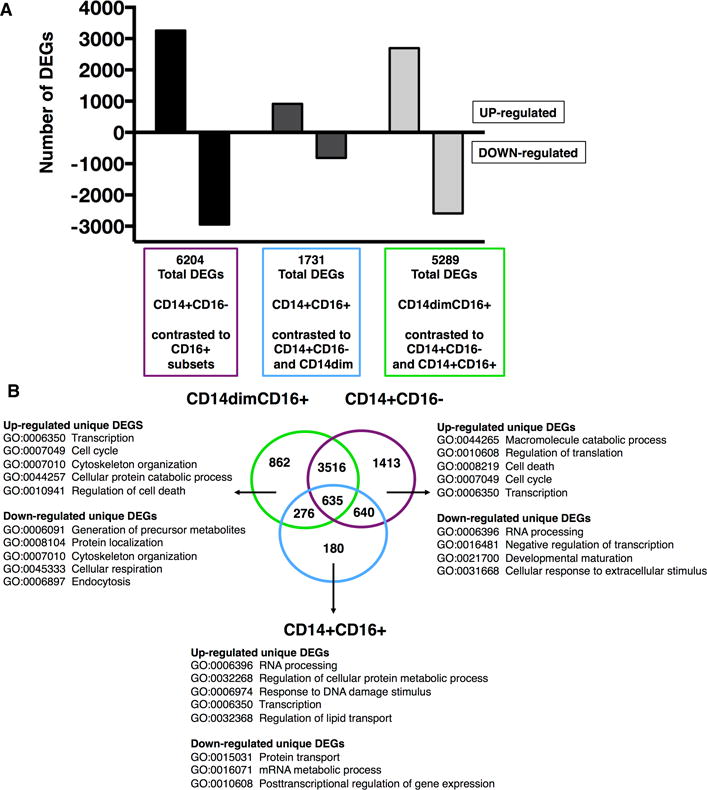
Compiled microarray data analysis from 18 samples (n = 9 per age group) for one subset was contrasted against the remaining two subsets. A total of 18, 615 transcripts were detected across the three contrasts. (A) Graph depicts the total number of differentially expressed genes (DEGs) (adjusted p value < 0.05) subdivided into up-regulated (positive fold-change (FC)) and down-regulated (negative FC) for each subset. (B) Venn diagram analysis of total DEGs revealed unique and common DEGs for each monocyte subset. Listed for each subset are selected top Gene Ontology (GO) biological processes related to unique up- and down-regulated DEGs.