
Figure 4. Adult contrasted to old subjects revealed distinct enriched transcripts in response to agonists.
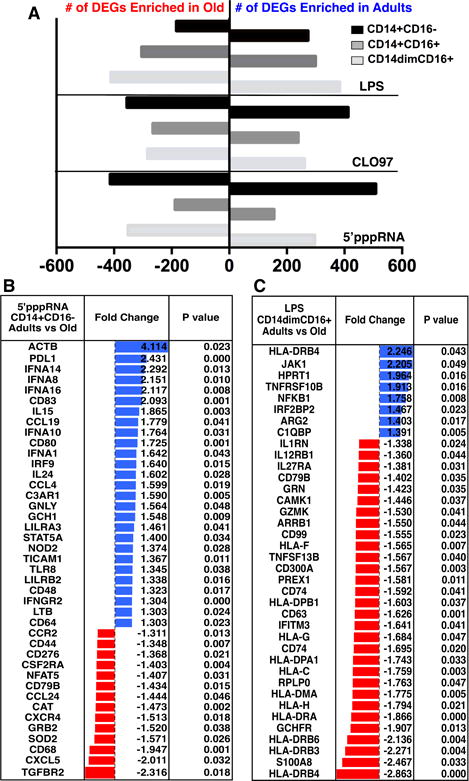
Transcriptional profiles for monocyte subsets from adults were contrasted to old subjects (n = 8 per age group). Differentially expressed genes were selected based on fold-change (FC) ≥ +1.3 or ≤ −1.3 and p value < 0.05. (A) Graph depicts the total number of DEGs for adults and old subjects for each treatment. (B–C) Tables show the FCs and p-values for selected enriched immune-related genes for 5′-pppRNA treated CD14+CD16− (B) and LPS treated CD14dimCD16+ (C) monocytes. Positive FC values (blue) indicate genes that are significantly enriched in the adults, whereas negative FC values (red) indicate genes that are significantly enriched in the old subjects.