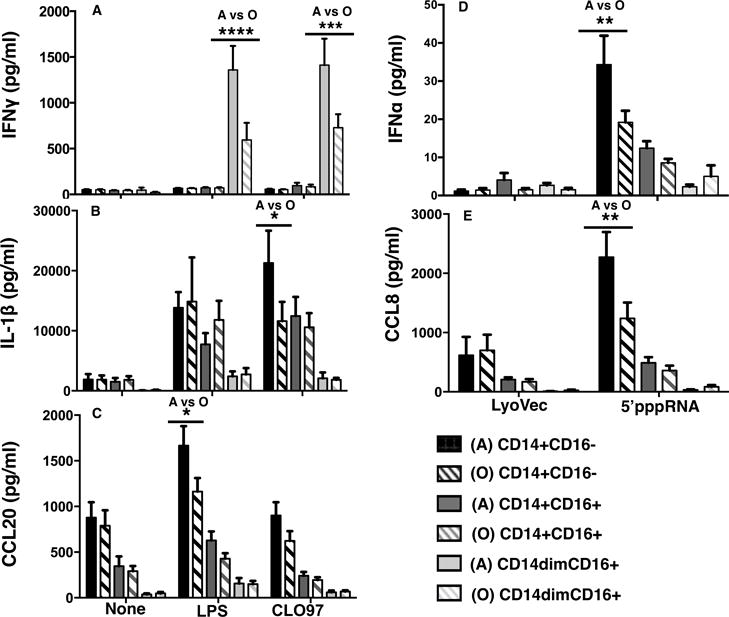
Figure 7. Age-related alternations in cytokine and chemokine production.

(A–C) Graphs depict the means ± SEM of IFNγ, IL-1β, and CCL20 concentrations in response to stimulation with LPS and CLO97 for up to 24 hrs for adult and old subjects. (D–E) Graphs depict the means ± SEM of IFNα and CCL8 concentrations in response to stimulation with 5′-pppRNA for up to 24 hrs for adult and old subjects. All concentrations were measured using the human chemokine 40-plex from Bio-Rad except for IFNα measured by ELISA. Asterisks indicate statistical significance (****) p value < 0.0001, (***) p value < 0.001, (**) p value < 0.01, and (*) p value < 0.05) between adults and old subjects using two-way ANOVA followed by Bonferroni correction for multiple comparisons. n = 8 per age group.
