
Figure 8. Age-related alterations in CX3CR1 surface receptor expression.
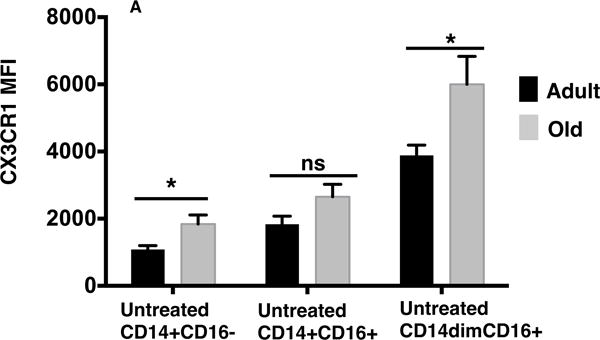
(A) Graph depicts the mean fluorescent intensity (MFI) of CX3CR1 for untreated monocyte subsets from adults (black) and old (gray) subjects. P values ((*) p value < 0.05) were calculated using unpaired t test with Welch’s correction. n = 8 per age group