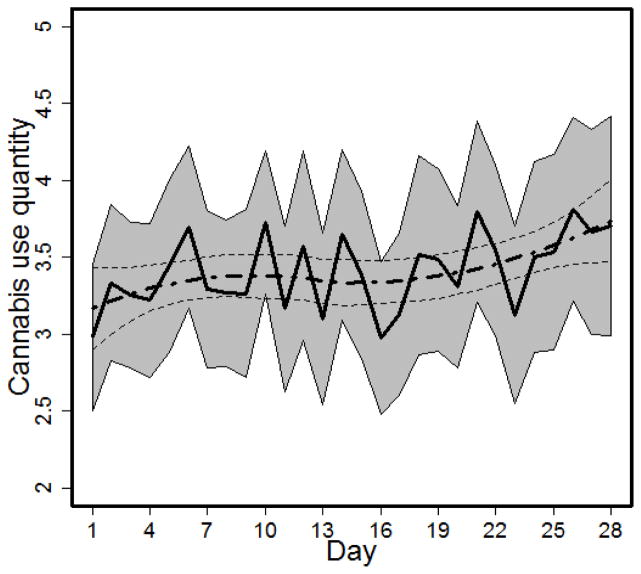
Figure 1.
Mean cannabis use quantity by survey day (range 1 to 28).
Note. Quantity was assessed using the following response options: <0.5g (<1 joint), 0.5g (1 joint), 1g (2 joints), 1.5g (3 joints), 2g (4 joints), or 2.5g+ (5+ joints); coded 1 to 6, respectively, for analyses. The solid black line represents cross-sectional estimates at each day, with point-wise confidence intervals in the gray shaded regions; the smooth curve estimates generated by a generalized additive model, with corresponding point-wise 95% CIs, are shown in dashed lines.

