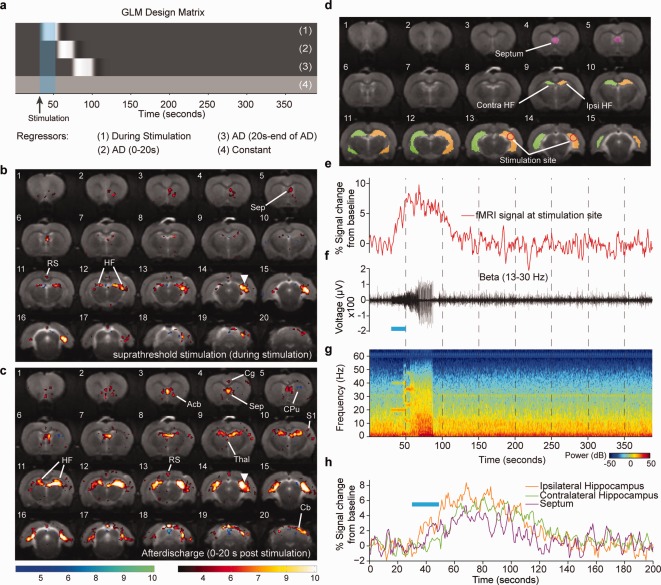
Figure 1.

Single‐subject simultaneous LFP and optogenetic fMRI during seizure‐inducing (suprathreshold) stimulation of the hippocampus. a: GLM design matrix for the fMRI analysis. b: T‐statistic map showing regions of significant blood‐oxygen‐level‐dependent (BOLD) signal change during a seizure‐inducing stimulation (average of two trials). c: T‐statistic map showing regions of significant BOLD signal change during the first 20 sec of an epileptiform afterdischarge. Site of optical stimulation is marked by the arrowhead. d: Segmentation of four different regions of interest. e: fMRI time course for a single trial. f: Single trial simultaneously recorded LFP for the β band 13–30 Hz. g: Spectrogram of the LFP recording during fMRI acquisition. h: fMRI time course for the single trial from the ipsilateral hippocampus, septum, and contralateral hippocampus. Duration of optical stimulations is marked by blue bar. T‐statistic maps are thresholded at a significance level of P < 0.01, voxel‐wise false discovery rate corrected. Acb, accumbens nucleus; CPu, caudate putamen; RS, retrosplenial cortex; Thal, thalamus; Cg, cingulate cortex; HF, hippocampal formation; S1, primary somatosensory cortex; Sep, septum. Figure is reproduced from Duffy et al., 2015, with permission from Elsevier.
