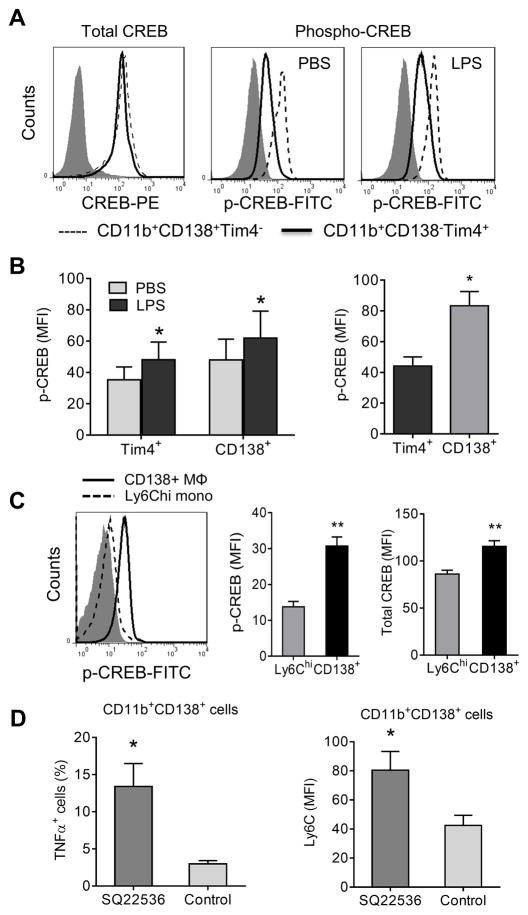
Figure 8. CREB activation.
A, Flow cytometry of total CREB and activated (p-CREB) staining. Peritoneal cells from untreated B6 mice were incubated with PBS or LPS (100 ng/ml) for 30 min. Total CREB and phosphorylated CREB (p-CREB) staining was compared between the CD11b+CD138+Tim4− (dashed line) and CD11b+CD138− Tim4+subsets (solid line). Isotype control: filled curve. B, p-CREB levels in CD11b+CD138+Tim4− and CD11b+CD138− Tim4+ cells from untreated mice. Data are representative of five separate experiments, total 20 mice. C, Activated CREB in Ly6Chi monocytes vs. CD138+ Mϕ. Left, comparison of p-CREB staining by flow cytometry in Ly6Chi monocytes (dashed line) and CD138+ Mϕ (solid line) from MO treated mice. Middle, p-CREB staining (mean fluorescence intensity, MFI) of Ly6Chi monocytes vs. CD138+ Mϕ. Right, total CREB staining (MFI) of Ly6Chi monocytes vs. CD138+ Mϕ. D, Effect of adenylate cyclase inhibition. Mice were treated with MO (0.5 ml i.p.) plus either SQ22536 (250 μg i.p. daily) or vehicle. At day 9, peritoneal exudate cells were surface stained for CD11b, CD138, Ly6C, and intracellularly stained for TNFα. The percentage of CD11b+CD138+ cells positive for TNFα (left) and the MFI of Ly6C staining (right) was determined by flow cytometry. *, P < 0.05; ** P < 0.01 (2-tailed t-test).

