Figure 3.

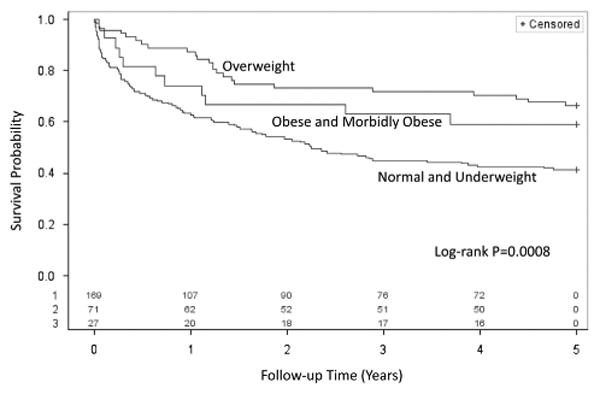
Kaplan-Meier survival curves for body mass index categories. Kaplan-Meier curves are shown for patients with the five BMI categories showing incremental survival benefit with increasing BMI quartiles (log-rank P = 0.008).

Kaplan-Meier survival curves for body mass index categories. Kaplan-Meier curves are shown for patients with the five BMI categories showing incremental survival benefit with increasing BMI quartiles (log-rank P = 0.008).