
Figure 1. Effect of diets on mouse atherosclerosis.
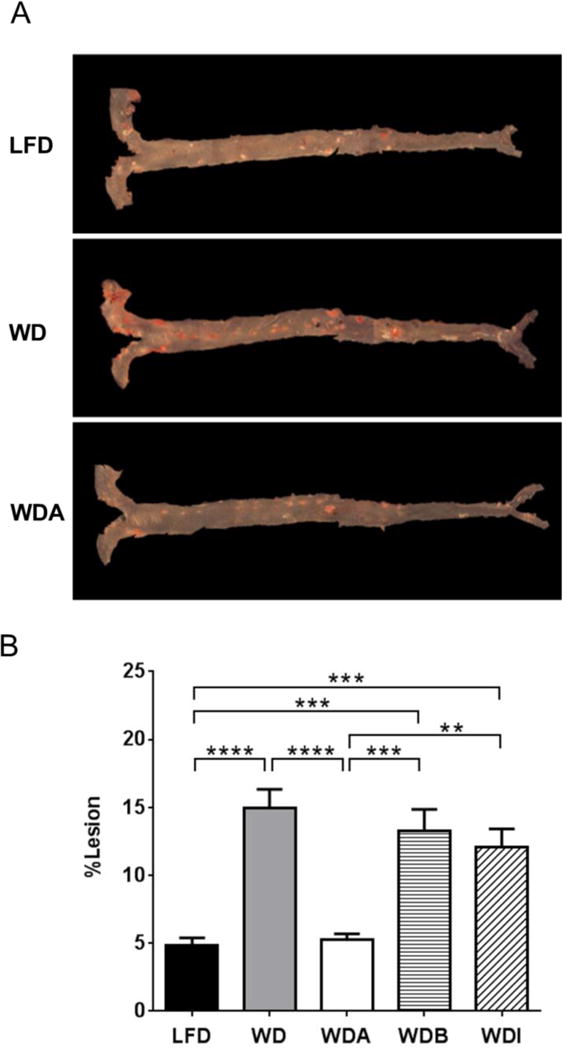
Representative images of aorta stained by Sudan IV (A) and comparisons of % atherosclerotic lesions in aorta among 5 diets (n=10–12 per group) (B). Data shown as mean ± SEM. **, ***, and **** represent p values of P < 0.01, P < 0.005 and P < 0.001, respectively.