
Figure 3. Effects of diets on plasma lipoprotein profiles.
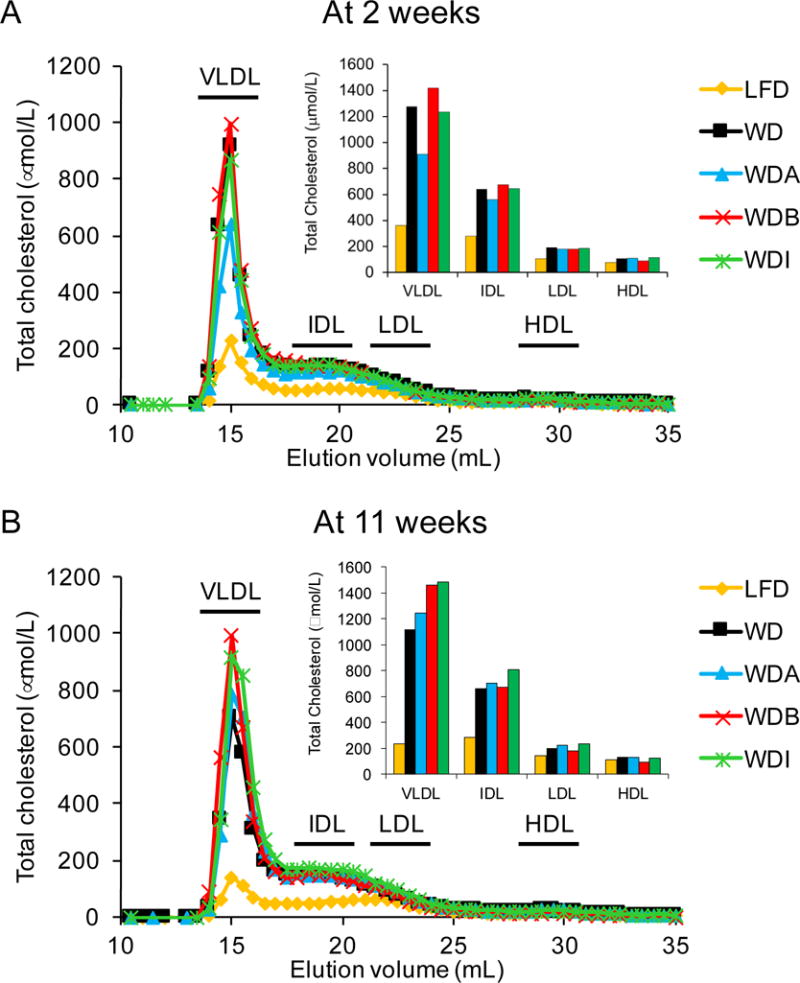
Pooled plasma (n=10–12 per group) from apoE-KO mice fed with the indicated diets for 2 weeks (A) or 11 weeks (B) was separated by FPLC and cholesterol was measured in the fractions. Inset: Sum of area under the curve for each lipoprotein fraction.