
Figure 6. Gut microbes change among the 5 diets.
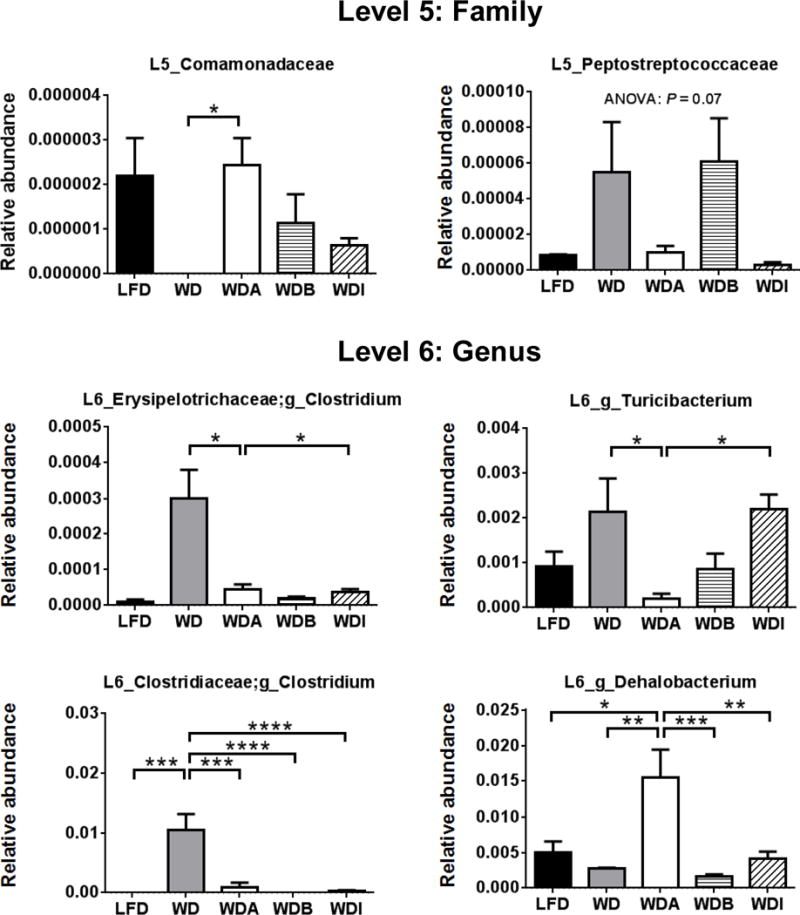
Bacterial species with significant differences between WD and WDA were extracted from all the data. Data shown as mean ± SEM (n = 4–5). *, **, ***, and **** represent p values of P < 0.05, P < 0.01, P < 0.005 and P < 0.001, respectively.