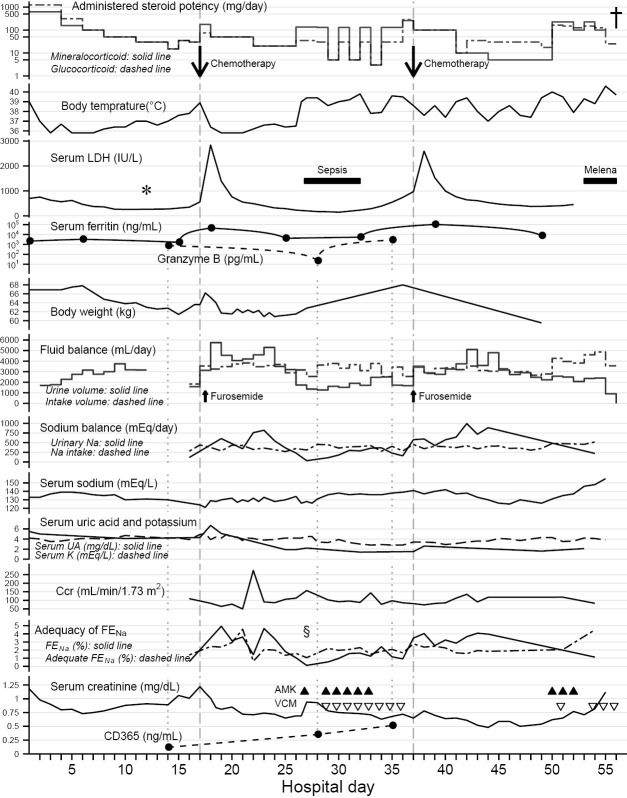
Figure 2.
Clinical course and laboratory findings in this case. The results of the lymph node biopsy (*) after methylprednisolone pulse therapy supported the use of chemotherapy for steroid-resistant high fever. The CHOP-like chemotherapies (down arrows) on hospital days 17 and 37 (vertical dashed lines) induced persistent polyuria and natriuresis after transient lactate dehydrogenase (LDH) surges in conjunction with the elevation of serum ferritin levels, with administration of corticosteroids with physiological mineralocorticoid potency. Negative fluid balance, negative sodium (Na) balance and body weight loss indicated volume depletion and salt wasting along with the polyuria. The low serum uric acid (UA) levels persisted even after recovery from the hyponatremia. Potassium (K) levels were managed with intravenous supplementation. The decreasing of granzyme B level on hospital days 28 reflected tumor burden; the simultaneous (as shown by vertical dotted lines) increase in CD365 levels indicated renal tubular damage. Fractional excretion of sodium (FENa) exceeded adequate FENa during polyuria, except during fever after the transient hypovolemic shock (§). This excess also suggested tubular dysfunction rather than tubular adaptation (16). Urine volume and urinary sodium excretion were independent of creatinine clearance (Ccr) levels, apart from sole spike of Ccr on hospital day 22. The administered steroid doses are shown to be equivalent to glucocorticoid and mineralocorticoid potencies of prednisolone by the following conversion coefficients: hydrocortisone, ×0.25 in glucocorticoid potency (dashed line), ×1.25 in mineralocorticoid potency (solid line); prednisolone, ×1.0, ×1.0; methylprednisolone, ×1.25, ×0.625; betamethasone, ×6.25, ×0.0 (17-19). Fluid intake includes oral fluids (negligible since hospital day 34), infused solutions, and transfusions. Sodium intake includes dietary salt (negligible since hospital day 24) and infused sodium. These were calculated from his dietary intake and infused dose, respectively, on the observation chart recorded during nursing. The urinary sodium excretion [mEq/day] was estimated by urine volume [mL/day] × urinary sodium concentration [mEq/mL] (sampled from pooled urine in a collection bag, but not 24-hour pooled urine). The Ccr [mL/min per body surface area 1.73 m2] was estimated by the following formula: urine creatinine concentration [mg/dL] (same samples as for urinary sodium excretion) × urine volume [mL/min] ×1.73/(serum creatinine concentration [mg/dL] × a constant value of patient’s body surface area [m2]). The FENa [%] was calculated by the following formula: 100× urinary sodium concentration [mEq/L] × serum creatinine concentration [mg/dL]/(serum sodium concentration [mEq/L] × urinary creatinine concentration [mg/dL]). The adequate FENa [%] was calculated by the following formula (16): sodium intake [mEq/day] / (0.0144× Ccr [mL/min] × serum sodium concentration [mEq/L]). The dagger (†) represents the patient’s death. The black triangle (▲) represents amikacin (AMK) and the open inverted triangle (▽) represents vancomycin (VCM). This figure was drawn using the ggplot2 software package, version 2.0.0 in R, version 3.2.2.

