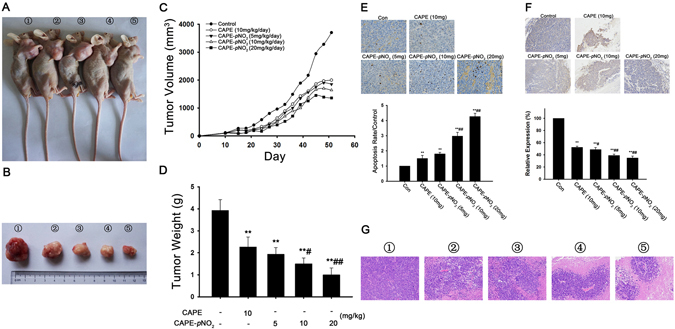
Figure 6.

CAPE and CAPE-pNO2 inhibit tumour growth in vivo. After 41-day treatment, tumours were observed in vivo (A) and in vitro (B); ①, ②, ③, ④ and ⑤ represented the control, CAPE-10 mg/kg/day, CAPE-pNO2-5 mg/kg/day, CAPE-pNO2-10 mg/kg/day and CAPE-pNO2-20 mg/kg/day groups, respectively. (C) After nude mice were injected with HT-29 cells for 9 days, CAPE and CAPE-pNO2 were given intragastrically for 42 days. The tumour volume was measured every three days. (D) Inhibition rate of tumour growth after treatment with CAPE and CAPE-pNO2. Apoptosis and expression were detected by TUNEL and immunohistochemistry. (E) TUNEL staining in tumours cells (×400), and the relative apoptosis rate was calculated using Image-Pro Plus (IPP) software. (F) Results of immunohistochemistry (×200). The integrated option density (IOD) value was used to measure the expression level of VEGF. (G) The paraffin sections of tumours were stained with haematoxylin and eosin (HE), and the necrotic area and shrinking nucleus were increased after treatment in a dose-dependent manner; ①, ②, ③, ④ and ⑤ represented the control, CAPE-10 mg/kg/day, CAPE-pNO2-5 mg/kg/day, CAPE-pNO2-10 mg/kg/day and CAPE-pNO2-20 mg/kg/day groups. Values represented the means ± SD from three independent experiments, and error bars represented the STDEV (SD). *p < 0.05, **p < 0.01: CAPE and CAPE-pNO2 compared with the control. # p < 0.05, ## p < 0.01: CAPE-pNO2 (5, 10, 20 mg/kg/day) compared with CAPE (10 mg/kg/day).
