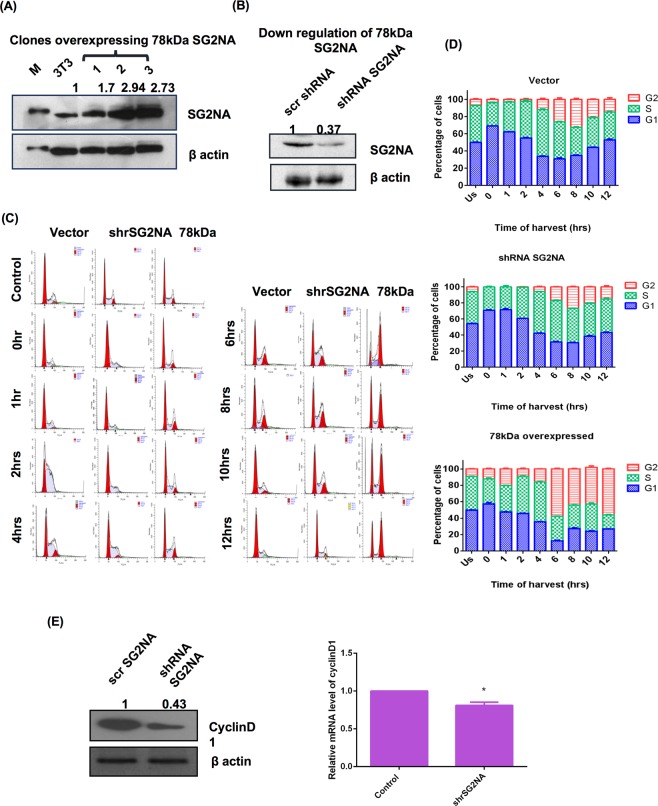
Figure 3.
SG2NA downregulation increases the G1 phase duration while upregulation increases G2 phase duration. (A) Cells stably overexpressing 78 kDa and (B) underexpressing SG2NA were harvested, 100 μg of cell lysates were loaded on SDS-polyacrylamide gel and immunoblotted with SG2NA and β-actin antibody. Numbers on the top of bands represent fold change in protein levels relative to untransfected NIH3T3 cells. (C) Representative FACS histograms of NIH3T3 cells stably transfected with vector alone, 78 kDa SG2NA and shRNA against SG2NA. (D) Graphical representation of the percentage of cells present in different phases of cell cycle during the cell cycle preogression. (E) Left panel: Lysates of normal NIH3T3 cells and SG2NA downregulated cells were loaded on SDS-polyacrylamide gel and probed with cyclin D1 and β-actin. Right panel: Graph representing real time analysis by qPCR for cyclin D1 mRNA expression in normal NIH3T3 cells and SG2NA downregulated cells. Error bars are the standard deviation of 3 experiments. *P < 0.05, **P < 0.01, ***P < 0.001. Full length blots for panel (A) and (B) are shown in Supplementary Figure S1.

