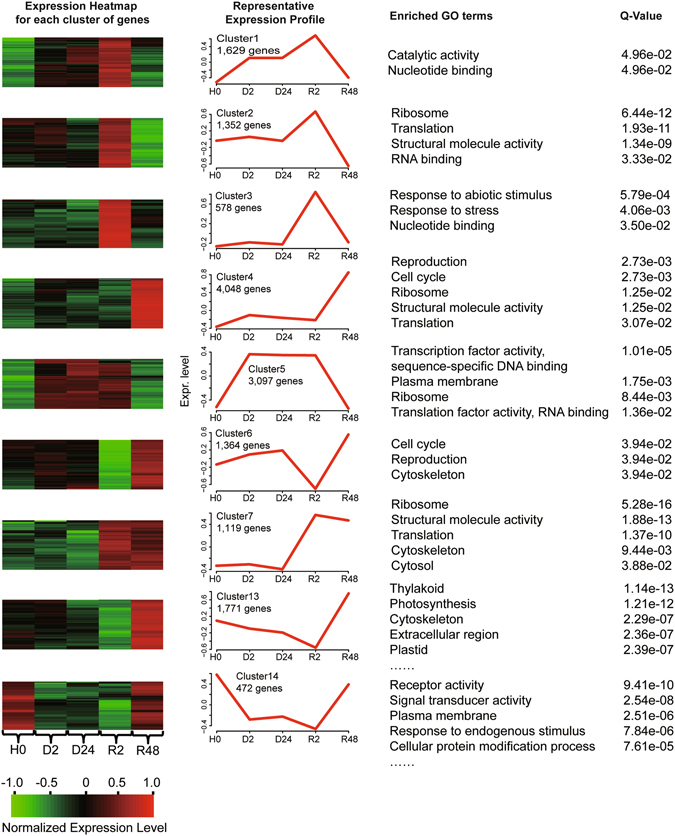
Figure 2.

Clusters of genes showing representative expression patterns during dehydration and rehydration. All of the significantly differentially abundant transcripts (SDATs) were selected, then SOTA function in the clValid package was employed to classify these SDATs into 16 categories. The nine categories with significantly enriched GO terms were shown here. The top GO slim-plant terms and corresponding enrichment FDR values were shown in the right panel.
