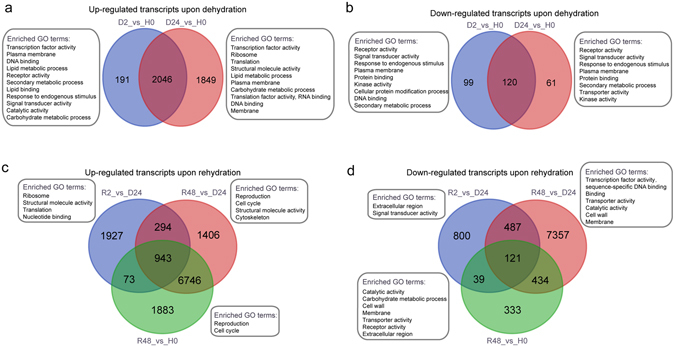
Figure 3.

Differentially abundant transcripts and significantly enriched GO terms during dehydration (a and b) and rehydration (c and d). (a and b), Number of transcripts with significantly elevated abundance (a) and decreased abundance (b) compared to hydrated control during dehydration with enriched GO-slim terms. c and d, Number of abundance elevated (c) and abundance decreased (d) transcripts compared to desiccated (D24) and hydrated control during rehydration with enriched GO-slim terms. H0: hydrated control, D2: dehydrated 2 h, D24: dehydrated 24 h, R2: rehydrated 2 h, R48: rehydrated 48 h.
