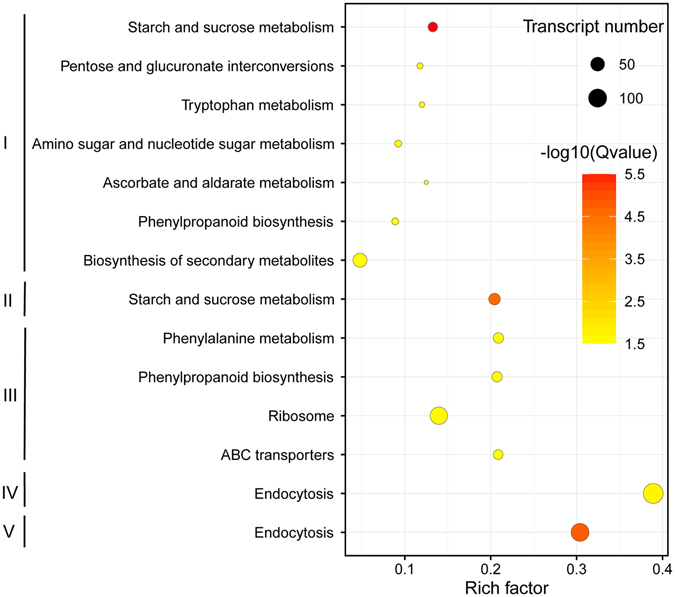
Figure 4.

Scatterplot of all statistically enriched KEGG pathways for differentially expressed genes during dehydration and rehydration. The characters I, II, III, IV and V in the figure correspond to the comparisons D2_vs_H0, D24_vs_H0, R2_vs_D24, R48_vs_D24 and R48_vs_H0, respectively. Rich factor was the ratio of the number of SDATs to the total gene number in a specific pathway. The size and color of the dots represent the transcript numbers and the FDR corrected P-values, respectively.
