
Figure 3.
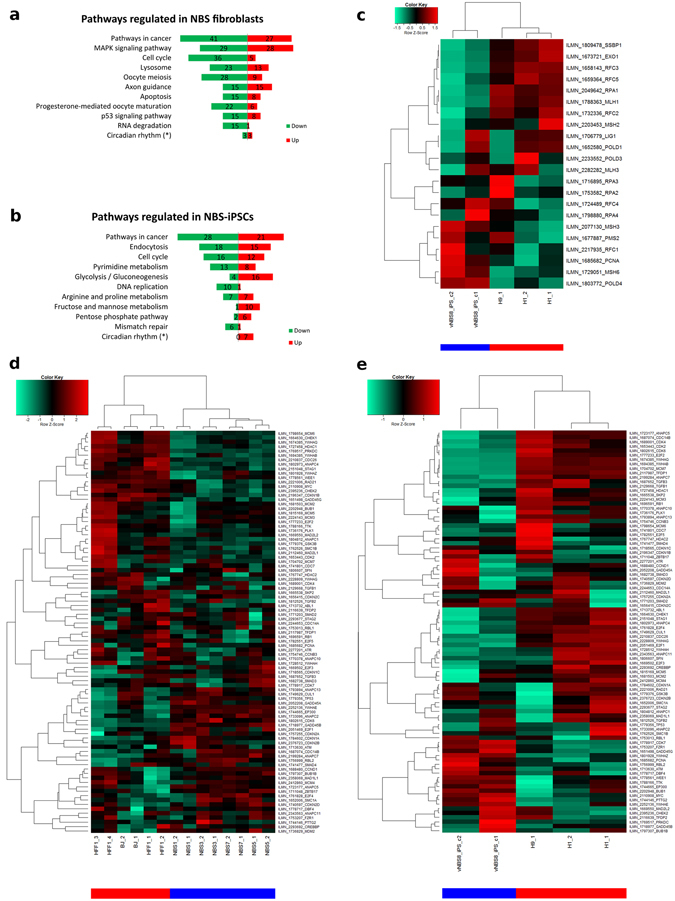
Functional transcriptomics study of NBS fibroblasts and iPSCs. Significantly de-regulated genes (differential p value < 0.05; fold-ratio > 1.5) between control and NBS-patient cells were analyzed by DAVID functional annotation tool (https://david.ncifcrf.gov/). The top 10 significantly (p value < 0.05) de-regulated KEGG pathways (http://www.genome.jp/kegg/pathway.html) are represented in the figure, numbers of significantly up-regulated genes are shown in red and down-regulated genes in green. (a) comparison between control (BJ, HFF1) and patient (NBS-1, -3, -5, -7) fibroblasts (b) comparison between control (H1, H9) and patient (vNBS8-iPS, clone 1 and 2) pluripotent stem cells. (*) p value of pathway > 0.05. The reprogramming procedure induced a shift of the Cell cycle pathway from down-regulated to nearly balanced. Furthermore, strong down-regulation of the Mismatch repair pathway was found in NBS-iPSCs. Cluster analysis and heatmaps of these de-regulated pathways are shown in (c–e): (c) depicts the Mismatch repair in NBS-iPSCs, (d) the Cell cycle in NBS fibroblasts and (e) the Cell cycle in NBS-iPSCs (Color bars: blue NBS, red control).