
Figure 3.
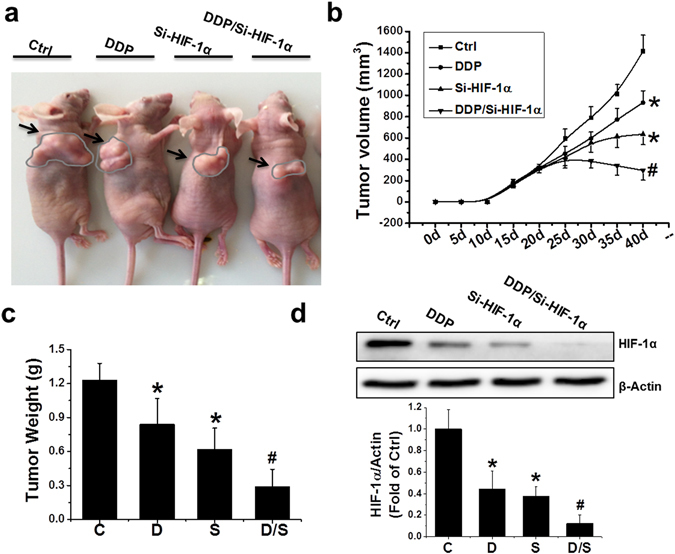
Inhibition of tumor growth in vivo by various treatments. (a) Macroscopic view of mouse tumors at the end of the study. (b) Tumor growth curves from day 0 to 40, with tumor sizes measured every 5 days, in various treatment groups as indicated. (c) Wet weight of tumors measured at the end of the study. (d) Protein expression of HIF-1α examined by western blot in PC-3 xenografts exposed to various treatments. Data were presented as mean ± SD (n = 6). *p < 0.05 versus control group; #p < 0.05 versus si-HIF-1α or DDP group. The original blots are presented in Supplementary Figure 6.