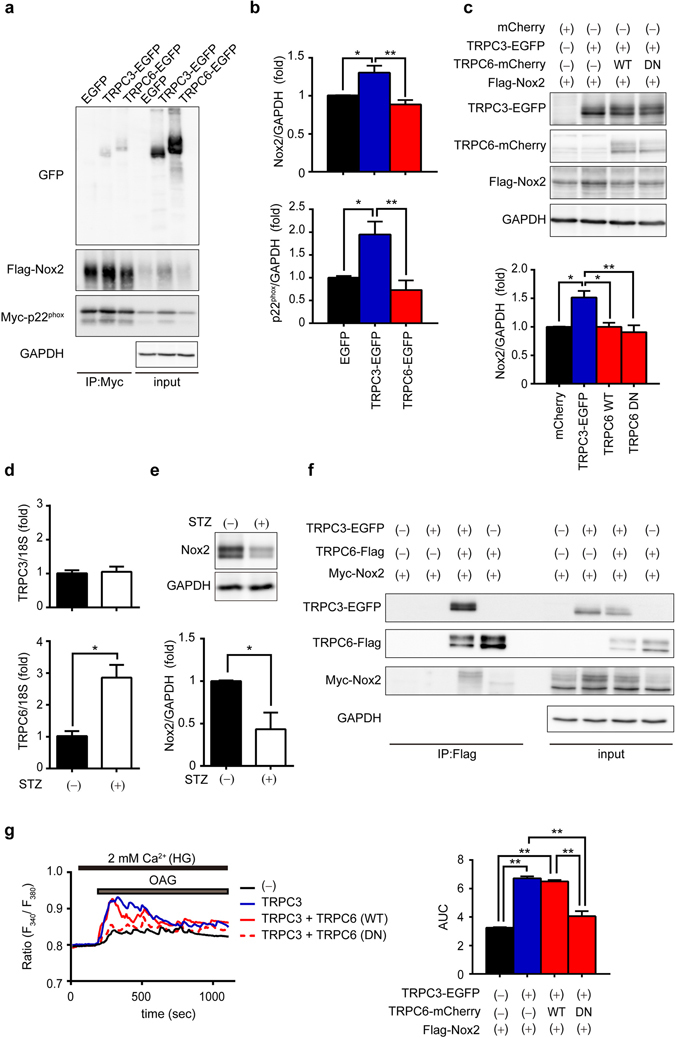
Figure 4.

Involvement of TRPC6 in hyperglycemia-induced Nox2 downregulation through inhibition of the TRPC3-Nox2 complex formation. (a) Interaction of TRPC6-EGFP with Flag-Nox2 and Myc-p22phox in HEK293 cells. Immunoprecipitation (IP) was performed using an anti-Myc antibody. Full-length blots are presented in Supplementary Fig. 3a. (b) Quantitative results of Nox2 and p22phox protein abundances in input samples. (n = 4 each) (c) Effects of expression of TRPC6 (WT or DN) on Nox2 stability in TRPC3-EGFP and Flag-Nox2-expressing HEK293 cells (n = 3 each). Full-length blots are presented in Supplementary Fig. 3b. (d) Expression levels of TRPC3 and TRPC6 mRNAs in mouse hearts with or without STZ treatment (n = 3 each). (e) Nox2 protein abundance in mouse hearts with or without STZ (n = 3 each). Full-length blots are presented in Supplementary Fig. 3c. (f) Formation of protein complex among TRPC3-EGFP, Myc-Nox2 and TRPC6-Flag. IP was performed using anti-Flag antibody. Full-length blots are presented in Supplementary Fig. 3d. (g) OAG (90 µM)-induced Ca2+ responses in HEK293 cells expressing EGFP (−), TRPC3-EGFP (TRPC3), TRPC3-EGFP and TRPC6-WT-mCherry (TRPC3 + TRPC6(WT)), and TRPC3-EGFP and TRPC6-DN-mCherry (TRPC3 + TRPC6(DN)). Averaged time courses (left) and [Ca2+]i increases shown as area under the curve (AUC, right) (n = 30 cells). Error bars, s.e.m. *P < 0.05, **P < 0.01.
