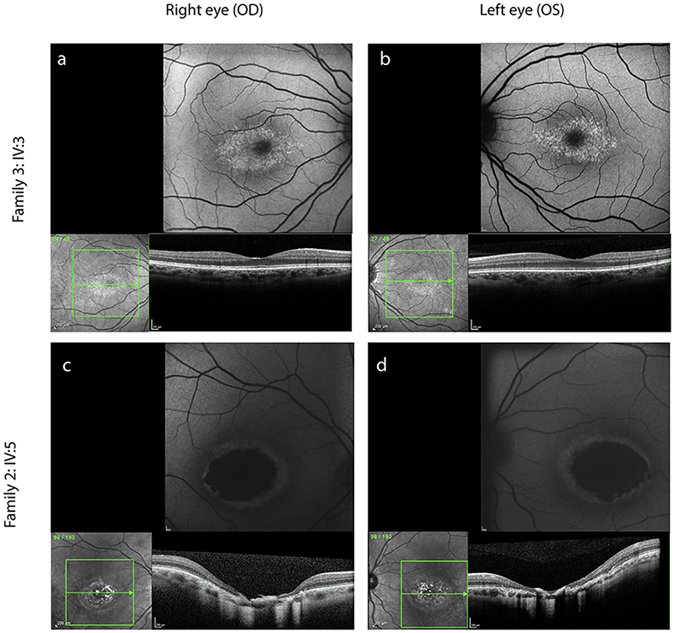
Figure 1.

NCMD typical clinical presentation in two selected individuals from family 3 (IV:3) and family 2 (IV:5). Each panel shows fundus autofluorescence and optical coherence tomography (OCT) images. Individual IV:3 (a,b) from family 3 shows a mild form of disease with relatively symmetrical, bilateral hyperfluorescent drusen-like deposits concentrated within the macular region and an otherwise normal OCT. Individual IV:5 (c,d) from family 2 presents with a well demarcated, relatively symmetrical and bilateral area of macular chorioretinal atrophy.
