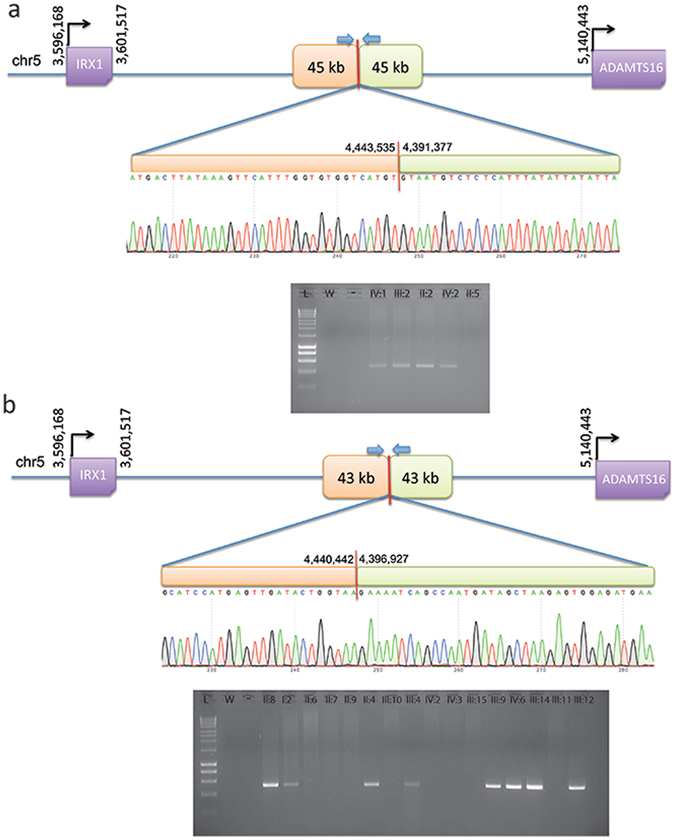
Figure 3.

PCR and Sanger sequencing validation of duplication breakpoints and segregation in family 1 (a) and family 2 (b). All available individuals (Supplementary Fig. S1) were tested with primers designed across the predicted breakpoints to generate a unique junction fragment sequence. The exact breakpoint is marked with a red bar; PCR primers are represented with blue arrows. L = ladder; W = water; “-” = genomic DNA pooled from control individuals.
