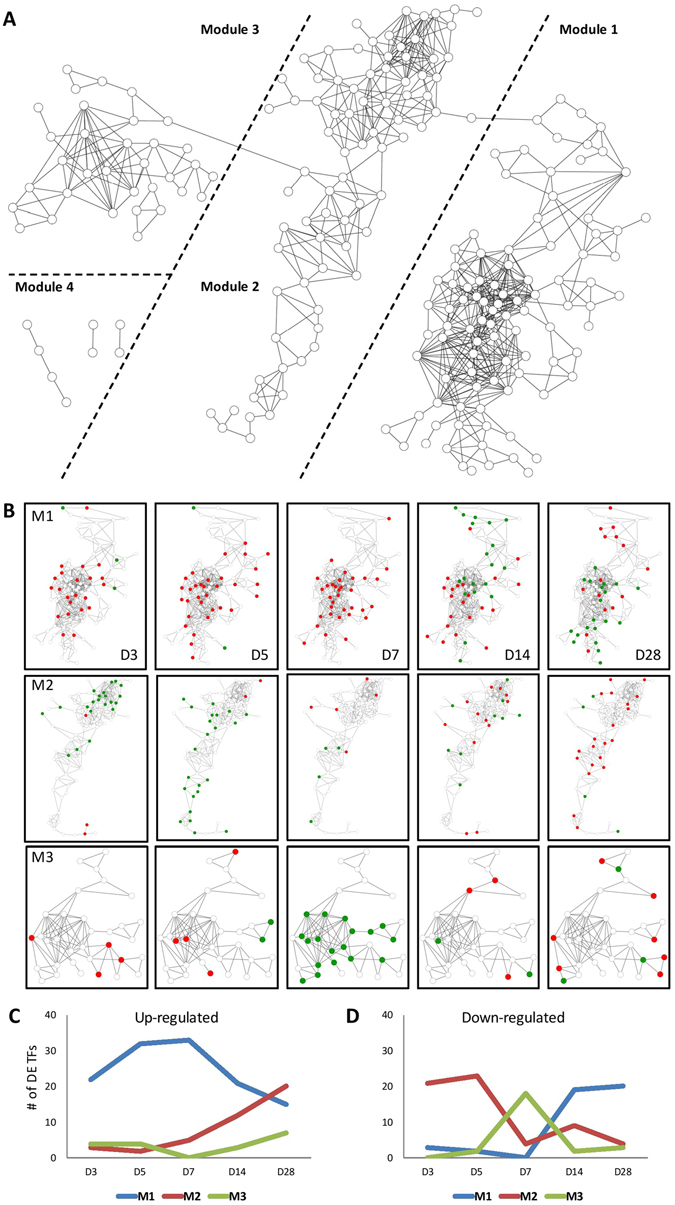
Figure 3.

A positive gene coexpression network for differentially expressed (DE) TF genes under the TAB condition. (A) The four modules of TF genes in the network. (B) TF genes in Modules 1, 2 and 3 have different patterns of differential expression at each time point. The red and green nodes, respectively, indicate the up- and down-regulated TF genes at the time point. The line charts represent the numbers of (C) up-regulated and (D) down-regulated DE TF genes in Modules 1, 2 and 3 at different time points.
