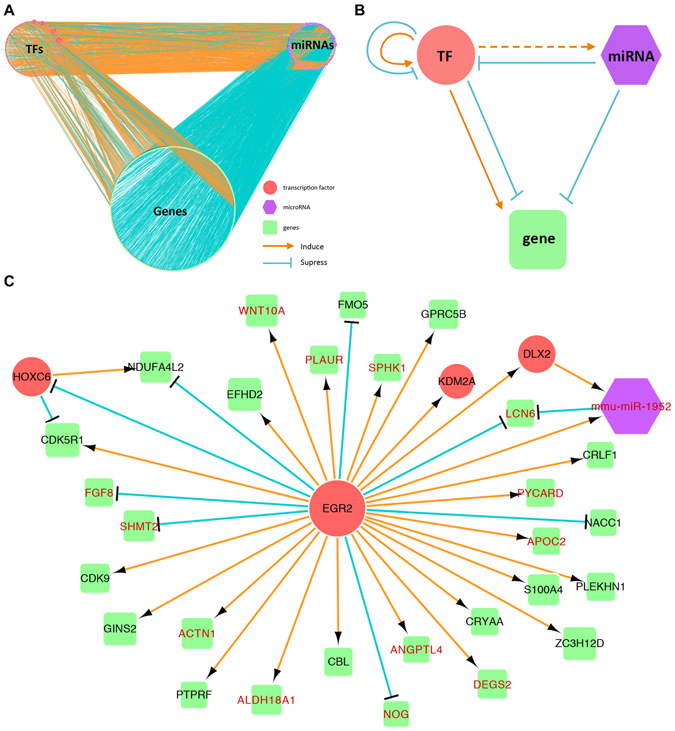
Figure 5.

The gene regulatory network in TAB. (A) Network for all TF genes (red nodes), non-TF genes (green nodes), and miRNAs (purple nodes) and the edges of positive (orange) and negative (blue) regulations in TAB. (B) A schematic gene regulatory network for a TF gene, a miRNA, and a non-TF gene. (C) A sub-network centered at the TF Egr2 gene to its direct targets, where genes with red name represent the cardiovascular-associated (CV) genes.
