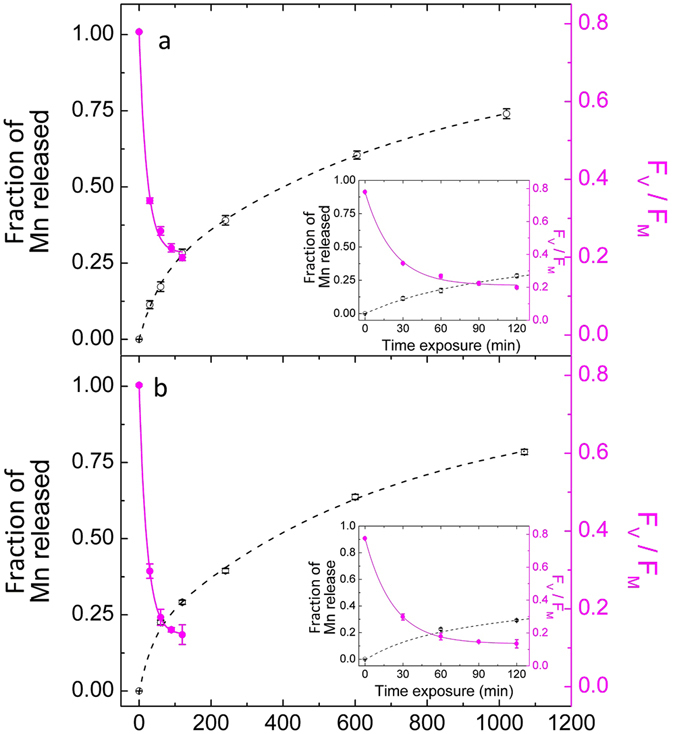
Figure 1.

Comparison between FV/FM ratio and the Mn2+ EPR signal illuminated between 460 and 660 nm. (a) 460 nm and (b) 660 nm. The black axis and line (doted) represent the normalised signal intensities of released Mn2+. The magenta axis and line (continuous) represent the signal intensities of FV/FM. The inset in each panel is a magnification of the first 120 min of illumination. Average values are presented ± standard error. For fluorescence measurements n = 6 and for EPR measurements n = 1.
