Figure 5.

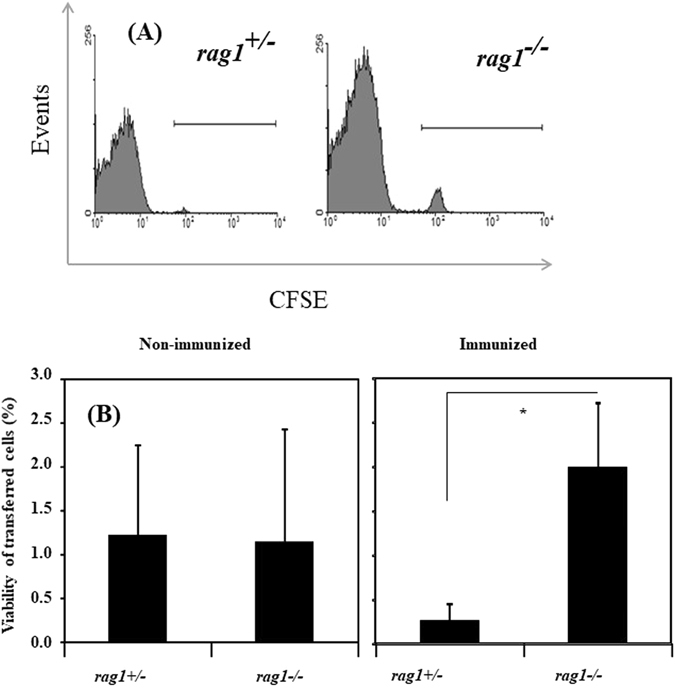
Rejection of allogeneic erythrocytes in rag1 +/− and rag1 −/− fish. Flow cytometry histograms show the transferred positive cells in rag1 +/− (left) or rag1 −/− recipients (right) (A). Horizontal bars in the histogram indicate the 5(6)-carboxyfluorescein diacetate N-succinimidyl ester-positive region. The data are representative of three independent samples. The percentage of variable transferred cells in recipients is shown in non-immunized and immunized fish (B). Asterisk (*) indicates a significant difference between the two strains (p < 0.05).
