Figure 3.

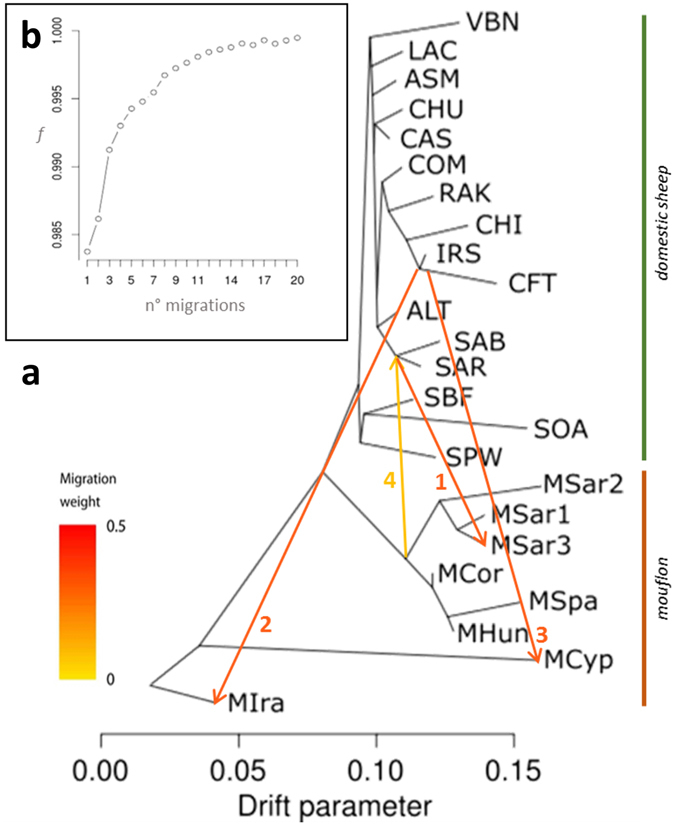
Treemix plot. (a) Phylogenetic network inferred by Treemix of the relationships between mouflon and domestic sheep populations. The first four migration edges between populations are shown with arrows pointing in the direction toward the recipient group, and coloured according to the ancestry percentage received from the donor. The numbers associated with each vector identify the identification order. (b) The inset shows the f index representing the fraction of the variance in the sample covariance matrix () accounted for by the model covariance matrix (), as a function of the number of modelled migration events. For population abbreviations see Table 1.
