
Fig. 4.
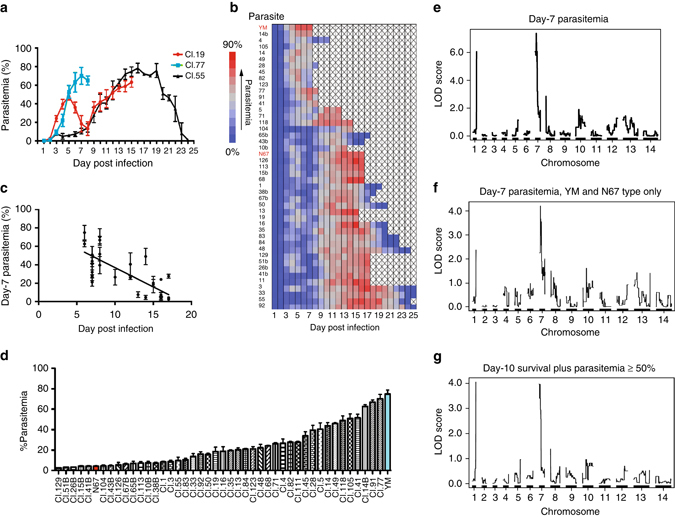
Parasitemia of YM × N67 cross progeny and LOD scores from quantitative trait loci analysis (QTL). a Parasitemia plots from three exemplar progeny. Mean parasitemia and SDs were from four mice. The parasitemia time course of Cl.77 is similar to that of YM; parasitemia of Cl.19 is similar to that N67; parasitemia of Cl.55 is similar to that of N67, but also declines to zero on day 25, representing a new phenotype. b Parasitemia time course of the two parents and 43 progenies arranged in order of pattern similarity. Missing (post mortem) measurements are indicated by “X” in the heatmap. c Correlation plot of day-7 parasitemia and the date of host death. Note that some of the progenies did not kill the host and were not plotted. d The mean day-7 parasitemia with SE’s of four mice from the parents (YM and N67) and their 43 progenies. Progeny names are as labeled. e LOD (logarithm of the odds) score plot of QTL analysis of day-7 parasitemia and genome-wide SNP genotypes of the progeny. f LOD score plot of QTL analysis of day-7 categorical phenotypes from 36 progenies with parasitemia patterns similar to either YM or N67 (excluding progeny Cl.4, Cl.14, Cl.28, Cl.45, Cl.49, Cl.82, and Cl.91 that died with declining parasitemia or intermediate phenotypes). g LOD score plot of QTL analysis of day-10 host survival plus parasitemia ≥50% when it died as phenotypes. QTL analysis was performed as described28, 58