
Fig. 5.
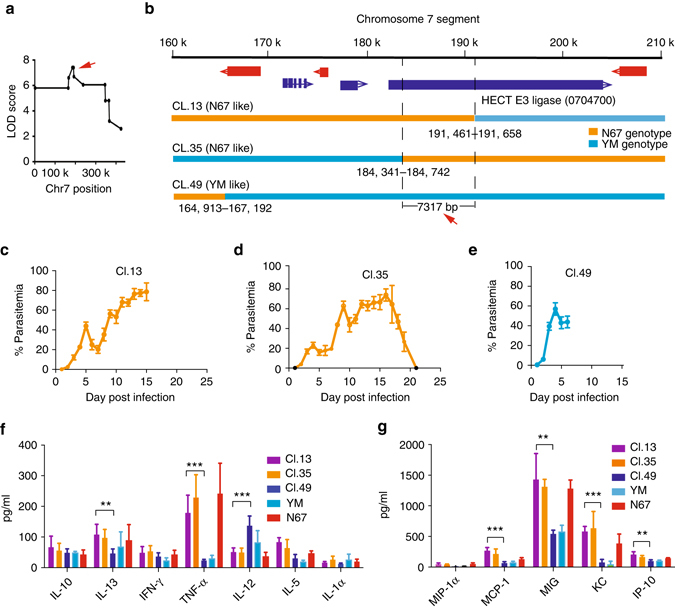
Fine-mapping of the chromosome 7 locus linked to parasitemia and host mortality. a Plot of peak LOD scores at the chromosome 7 locus, showing the site with peak LOD score (red arrow). b Expanded view of the chromosome 7 locus showing candidate genes and crossover sites for three progenies with genetic recombination within the locus. Genetic markers in a 7.3 kb segment has the highest LOD score defined by crossovers in progenies Cl.13 and Cl.35. c–e Plots of the mean parasitemia with SD from three to five mice infected with three progeny as indicated. f, g Cytokine/chemokine levels (means and SDs) from five mice infected with the parents and three progenies, measured using a mouse magnetic 20-plex kit (Invitrogen) in a Luminex-200 machine according to the manufacturer’s instructions. Two-sided t-test, **P < 0.01; ***P < 0.001