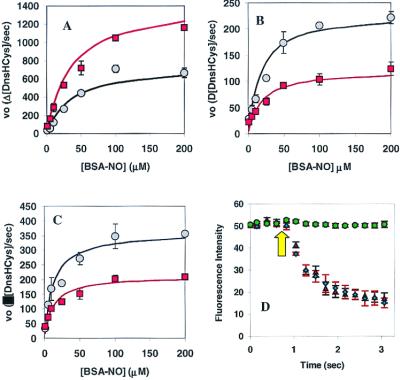
Figure 5.
Kinetics of csPDI-catalyzed intracellular DnsHCys S-nitrosation. (A) Initial rates of intracellular DnsHCys fluorescence quenching as a function of BSA-NO concentration. Control HT1080 cells are indicated by circles, and HT1080 cells overexpressing csPDI are indicated by squares. The error bars represent SD (n = 6). The solid line represents the best fit of the data to the Michaelis–Menten equation. (B) Initial rates of intracellular DnsHCys fluorescence quenching as a function of BSA-NO concentration. HUVECs, no inhibitor (circles); 100 μM DTNB (squares). The error bars represent SD (n = 6). The solid line represents the best fit of the data to the Michaelis–Menten equation. (C) Initial rates of intracellular DnsHCys fluorescence quenching as a function of BSA-NO concentration. Hamster lung fibroblasts, no inhibitor (circles); 100 μM DTNB (squares). The error bars represent SD (n = 6). The solid line represents the best fit of the data to the Michaelis–Menten equation. (D) Dynamic fluorescence quenching of intracellular DnsHCys fluorescence on the addition of 200 μM BSA-NO (indicated by arrow). HUVECs, no inhibitor (triangles); 100 μM GSAO (circles); 100 μM 4-(N-(S-glutathionylacetyl)amino)benzoic acid (diamonds). The error bars represent SD (n = 6).

