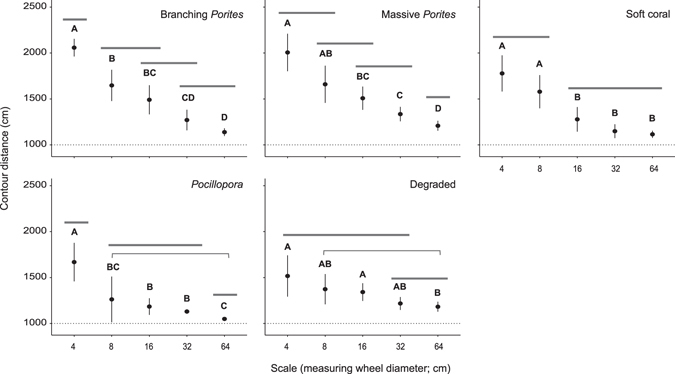
Figure 4.

Modelled contour distance (±95% confidence intervals) measured using wheels representing scales 4–64 cm (wheel diameters, cm: 3.99; 7.97; 15.95; 31.89; 63.79), within each habitat. Significant differences between habitats revealed by linear mixed effects modelling and post hoc Tukey pair-wise comparisons are illustrated by the pairing of letters (P < 0.05). Grey bars across scales further illustrate similarities in structural complexity across scales of measurement in each habitat. Thin grey bars in Pocillopora and Degraded habitats denote similarities in contour distance over scales at either end of the bar (i.e. non-consecutive sales).
