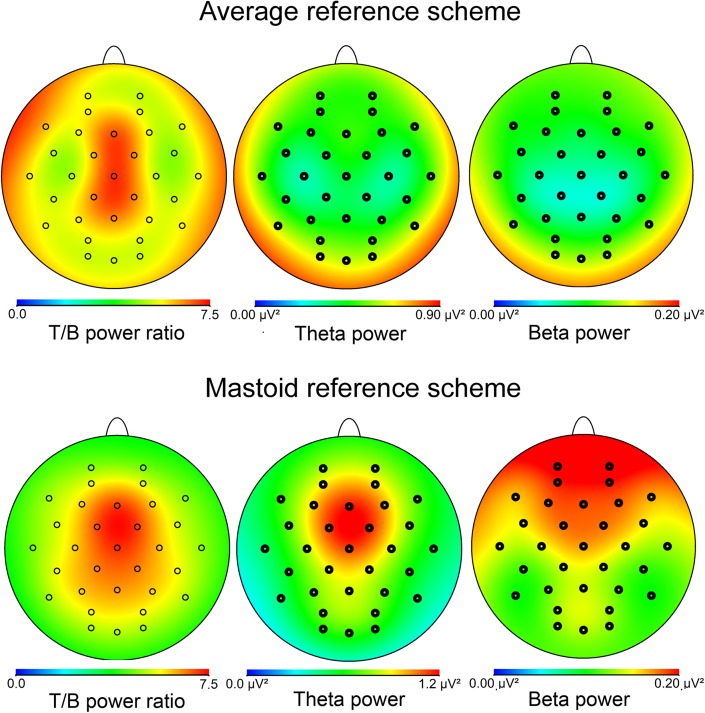
Fig. 2.
The topographical distribution of theta/beta EEG ratio, theta and beta power across the scalp. Theta/beta EEG ratio was maximal over midline frontal sites (Fz) (above, left). The other figures in the top row represent the topographical distribution of theta (middle) and beta power (right). Theta and beta power plotted separately were maximal over the parieto-occipital cortex when using the average reference. This pattern has also been found in a study by Cavanagh et al. (2012) and is a feature of the average reference. In contrast, the theta and beta power bands (as well as the theta/beta EEG ratio) showed a frontal maximum when the averaged mastoids were used as a reference (bottom row, middle and right figure, respectively). Note that the ratio between theta and beta power cancelled out the effects of the reference method on the scalp distribution of the power values

