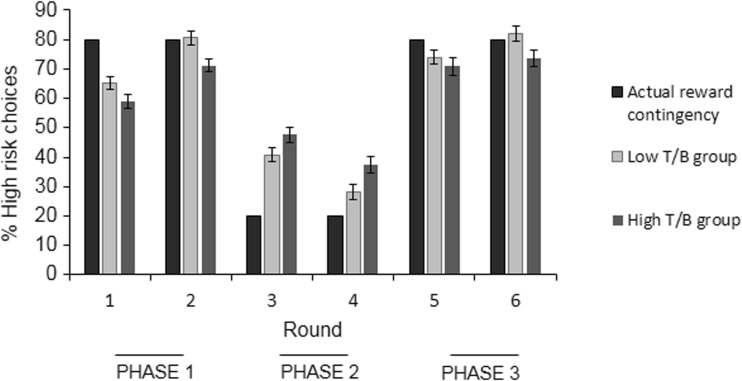
Fig. 5.
Percentage of high-risk choices during each round for the high and low theta/beta EEG ratio group. Participants were categorized as having either a low (light grey bars) or a high (dark grey bars) theta/beta EEG ratio, based on a median-split. The figure represents the percentage high risk choices during each of the six rounds for both groups separately, relative to the actual reward contingency during each round (black bars). Error bars represent ±1 SE

