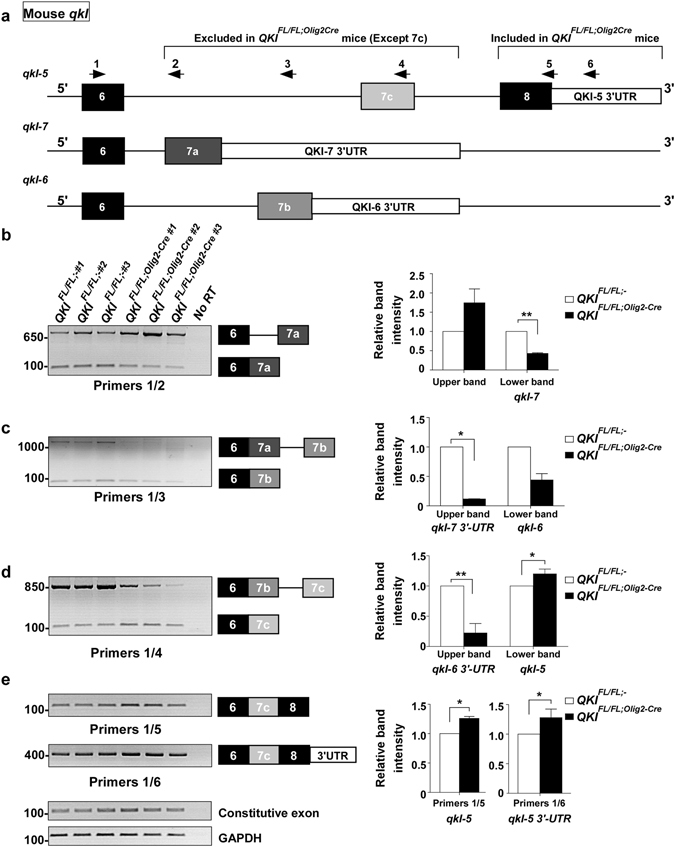
Figure 6.

QKI proteins regulate self-splicing in mice. (a) A schematic of the 3′-UTR of mouse qkI gene. Arrows indicate location of primers used for splicing analysis. Primer 1 is in exon 6 that is common to all QKI isoforms. (b) (Left) RT-PCR analysis using primers #1 and #2 from n = 3 mice brain RNA/genotype. The lower band corresponds to qkI-7 isoform (exon 6; 7a) whereas the upper band corresponds to the unspliced pre-mRNA. (Right) The pixel densities of PCR bands from 3 independent mice brain RNA samples were quantified using ImageJ software, normalized over constitutive exon, and then normalized over wild-type mice represented as mean ± SEM (Student t-test, **p < 0.001). (c) (Left) RT-PCR analysis using primers #1 and #3 from n = 3 mice brain RNA/genotype. The lower band corresponds to qkI-6 isoform (exon 6; 7b) whereas the upper band corresponds to qkI-7 3′-UTR. (Right) The pixel densities of PCR bands from 3 independent mice brain RNA samples were quantified using ImageJ software, normalized over constitutive exon and then normalized over wild-type mice and represented as mean ± SEM (Student t-test, *p < 0.05). (d) (Left) RT-PCR analysis using primers #1 and #4 from n = 3 mice brain RNA/genotype. The lower band corresponds to qkI-5 isoform (exon 6; 7c) whereas the upper band corresponds to qkI-6 3′-UTR. (Right) The pixel densities of PCR bands from 3 independent mice brain RNA samples were quantified using ImageJ software, normalized over constitutive exon and then normalized over wild-type mice and represented as mean ± SEM (Student t-test, *p < 0.05, **p > 0.01). (e) (Left) RT-PCR analysis using primers #1 and #5 (qkI-5 isoform: exon 6; 7c; exon8), primers #1 and #6 (qkI-5 isoform: exon 6; 7c; exon8; 3′-UTR), constitutive qkI exon 1, and GAPDH from n = 3 mice brain RNA/genotype. (Right) The pixel densities of PCR bands from 3 independent mice brain RNA samples were quantified using ImageJ software, normalized over constitutive exon and then normalized over wild-type mice and represented as mean ± SEM (Student t-test, *p < 0.05).
