
Figure 6.
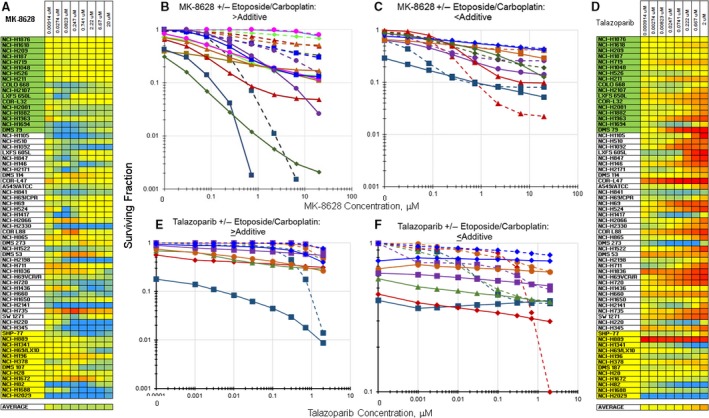
Heatmap and concentration response curves for the addition of the BET bromodomain inhibitor, MK‐8628, or the PARP1 inhibitor, talazoparib, to etoposide/carboplatin in the SCLC lines. (A) Heatmap with the 63 SCLC lines listed from least responsive to most responsive to etoposide. Blue indicates greater than additive response to the combination of MK‐8628 with etoposide/carboplatin (I t = −0.281 ± 0.290). Yellow indicates additivity of MK‐8628 with etoposide/carboplatin. Red indicates less than additive response to the combination of MK‐8628 with etoposide/carboplatin. (B) Concentration response curves for representative SCLC lines exposed to MK‐8628 alone (dotted lines), or to the combination of MK‐8628 with etoposide (0.3 μmol/L) and carboplatin (3.7 μmol/L) (solid lines) that produced greater than additive cell killing. (C) Concentration response curves for representative SCLC lines exposed to MK‐8628 alone (dotted lines), or to the combination of MK‐8628 with etoposide (0.3 μmol/L) and carboplatin (3.7 μmol/L) (solid lines) that produced less than additive cell killing. The color of the lines (dotted and solid) indicate the same SCLC line. (D) Heatmap with the 63 SCLC lines listed from least responsive to most responsive to etoposide. Blue indicates greater than additive response to the combination of talazoparib with etoposide/carboplatin. Yellow indicates additivity of talazoparib with etoposide/carboplatin (I t = −0.281 ± 0.290). Red indicates less than additive response to the combination of talazoparib with etoposide/carboplatin. (E) Concentration response curves for representative SCLC lines exposed to talazoparib alone (dotted lines), or to the combination of talazoparib with etoposide (0.3 μmol/L) and carboplatin (3.7 μmol/L) (solid lines) that produced greater than additive cell killing. (F) Concentration response curves for representative SCLC lines exposed to talazoparib alone (dotted lines), or to the combination of talazoparib with etoposide (0.3 μmol/L) and carboplatin (3.7 μmol/L) (solid lines) that produced less than additive cell killing. The color of the lines (dotted and solid) indicate the same SCLC line.