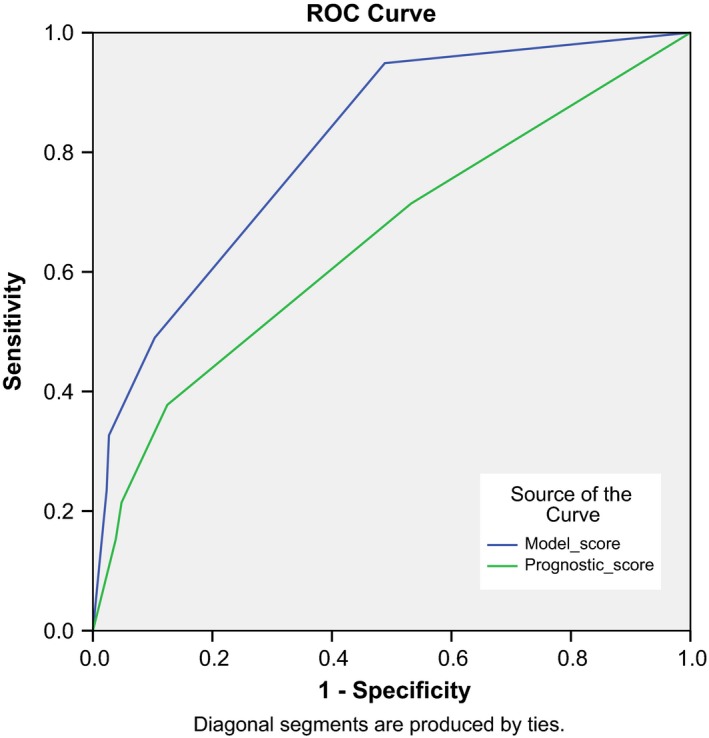
Figure 2.

ROC curve of the prediction algorithm for delirium. These curves show the sensitivity and specificity of the different cut‐off points in the algorithm. AUC of the original model (blue line) is 0.81 and 0.65 for the cross‐validated model (green line).
