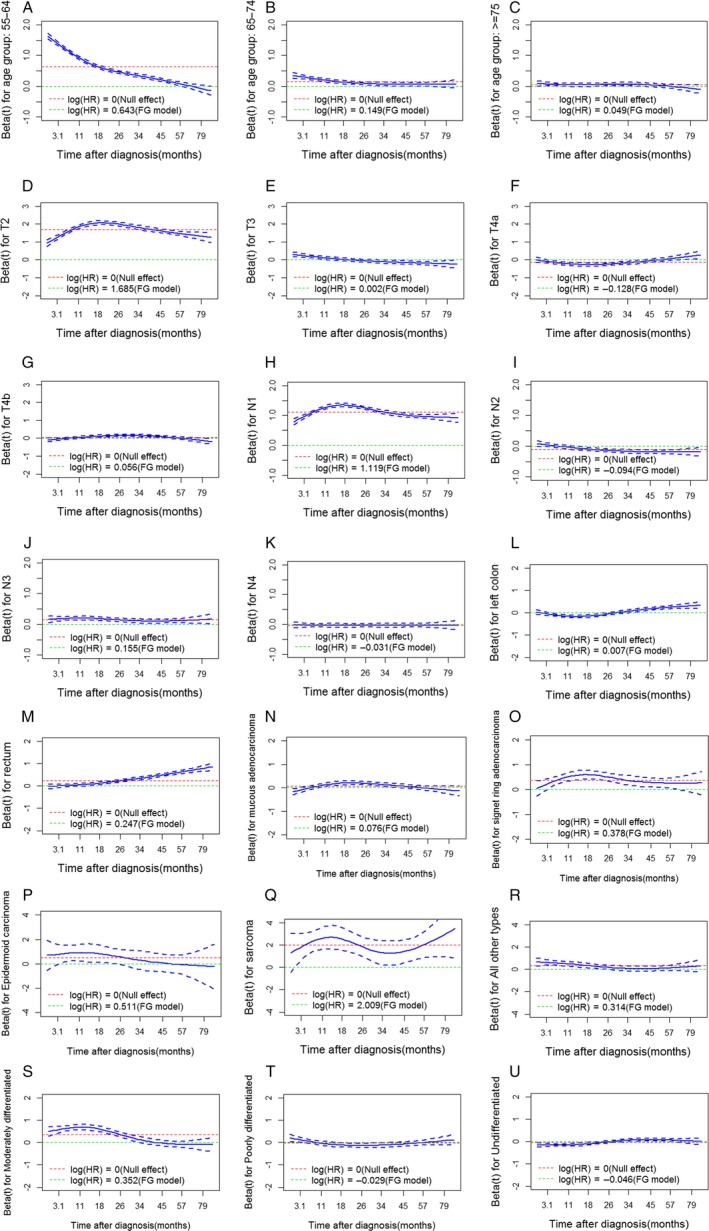
Figure 3.

Scaled Schoenfeld residuals for age at diagnosis, T stage, N stage, tumor site, histological type, and tumor grade with 95% confidence intervals. Residuals were used to visualize the log cause‐specific hazard rates for each covariate over time. Green lines represent the null effect (no effect on survival outcomes when Log(HR) is equal to 0), and red lines represent the average log cause‐specific hazard rate as estimated using the Fine and Gray (FG) model. The 55–64‐year‐old age group (A), 65–74‐year‐old age group (B), T3 (E), T4a (F), N1a (H), N1b (I), moderately differentiated tumor grade (S), undifferentiated tumor grade (U), other histological types (R), and tumor site (L, M) were found to be most likely to contribute to nonproportionality. For example, for age between 55 and 64 years, the effect changed over time, tending to diminish in the early years and then become protective later. For age between 65 and 74 years, this group had a higher risk than did the baseline group (age < 55 years) in the early years, whereas this impact tended to disappear later. For age older than 74 years, the effect tended to be constant. The FG model in the figure represents the Fine and Gray model, and HR represents the subdistribution hazard rate.
