
Figure 4.
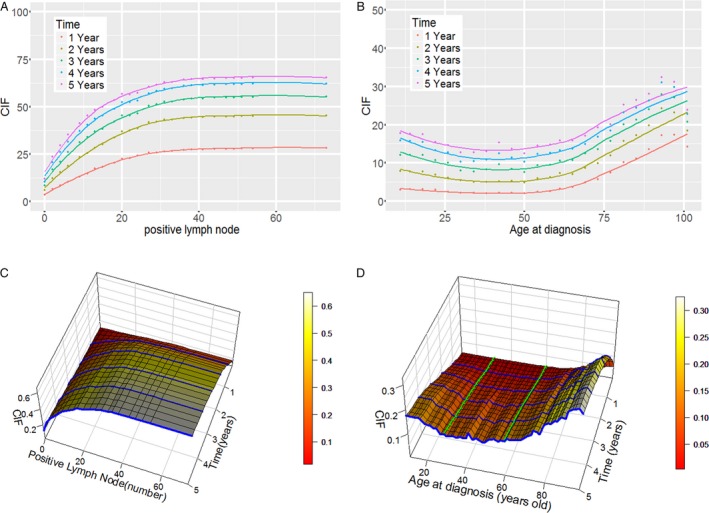
Nonlinear effects of positive lymph node and age at diagnosis in nonmetastatic colorectal cancer and their three‐dimensional cumulative incidence curves. Panel A shows the nonlinear effect of a diagnosis of positive lymph nodes; panel B shows the nonlinear effect of age at diagnosis; panel C shows the cumulative incidence function of a diagnosis of positive lymph nodes, where the blue lines represent 1‐ to 5‐year cumulative incidence functions as the number of positive lymph nodes increases; and panel D shows the cumulative incidence function of age at diagnosis, where the blue lines represent 1–5‐year cumulative incidence functions as age at diagnosis increases and the green lines represent cumulative incidence functions as time progresses when age at diagnosis was fixed at 30 and 60 years old. CIF represents the cumulative incidence function.