
Figure 7.
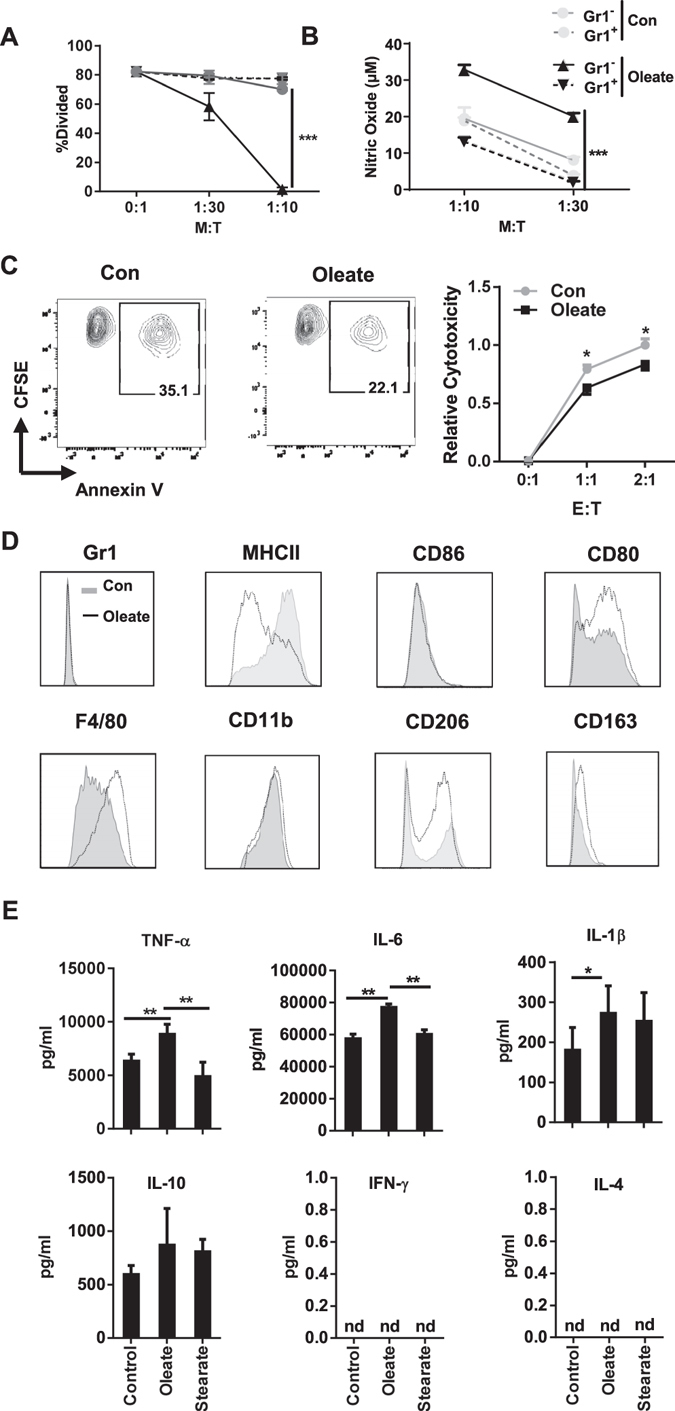
Gr1− but not Gr1± cells exhibit enhanced immunosuppressive capacity after oleate treatment. Bone marrow cells were polarized in the presence of 40 ng/ml GM-CSF and treated with the indicated compounds for 7 days. Gr+ and Gr1− populations were purified via beads and co-cultured with purified CD4+ T cell in the ratios indicated for functional assay (A). NO production from the co-culture supernatant was quantified by Griess reaction (B). CTLs were polarized and coincubated with purified Gr1− cells for 18 hours. The suspension cells were harvested and cocultured with CFSE labelled E.G7 OVA cell line for 90 mins. The proportion of Annexin V+ cells gated from CFSE+ population was used to calculate the cytotoxicity of CTLs (Formula in the Methods section) (C). Surface marker panel of Gr1− cells from either control or oleate group was performed via flow cytometry (D). Purified Gr1− cells were stimulated by 1 µg/ml LPS in 24 hours and then supernatants were collected for cytokine analysis (E). Shown is the mean ± SD from two to four independent experiments. *p < 0.05; **p ≤ 0.01;***p ≤ 0.001.