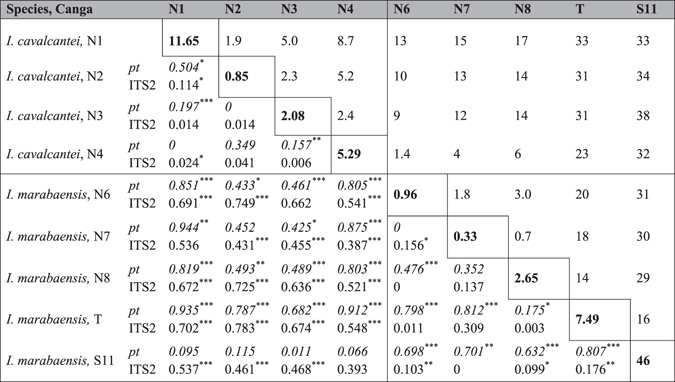
Table 1.
Canga areas, geographic distances and genetic differentiation of I. cavalcantei and I. marabaensis populations. The values along diagonal (in bold) are areas of Cangas (km2). Values above diagonal are the shortest distances between Canga islands (km). The pairwise genetic differentiation measured by the population descriptive statistics is shown below the diagonal. The F ST values from the plastome (pt) gene alleles, emphasized by italics font, and internal transcribed rDNA spacer alleles (ITS2) are combined in the same cells. Asterisk are the p values: *<0.05; **<0.01; ***<0.001.

