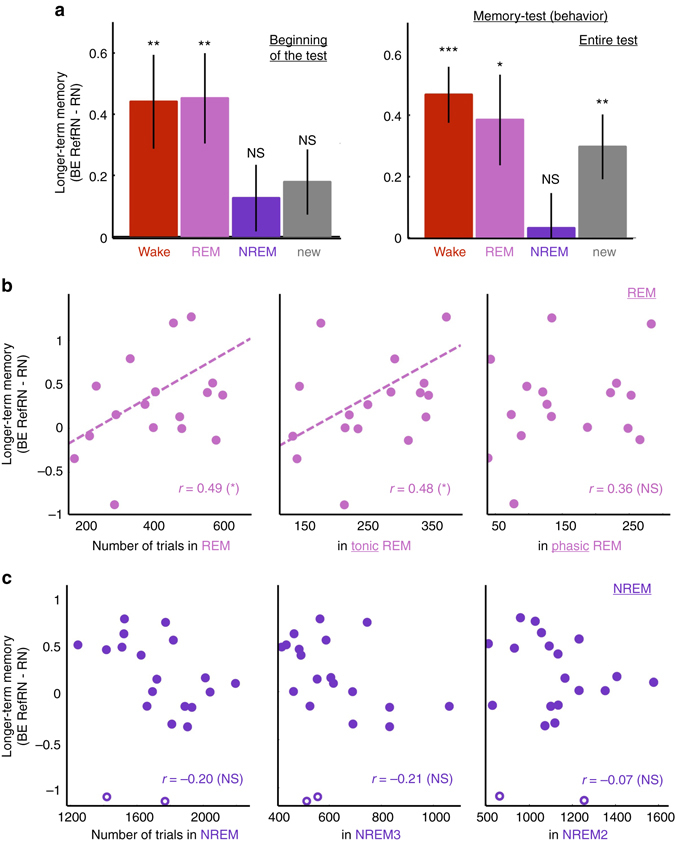
Fig. 3.

Impact of prior exposure on behavioral performance upon awakening. a Behavioral efficacy indexes of longer-term memory (RefRN—RN) computed for the beginning (left, 3 first trials) or the entire (right) post-sleep blocks. BE was computed separately for the RefRN heard during wakefulness, REM, NREM, or for the novel RefRN introduced in the post-sleep phase. Error bars denote the standard error of the mean across participants (N = 20). Stars atop bars indicate the results of the statistical tests (t-tests against 0, P < 0.001: ***; P < 0.01: **; P < 0.05: *, NS: P ≥ 0.05). Performance is better for RefRN sounds heard during wake and REM sleep at the beginning of post-sleep blocks. For the whole test analysis, all conditions improve as participants could learn even new RefRNs during the block, with the notable exception of RefRN sounds heard during NREM sleep: those were not learnt even after the whole test. b Correlation between the REM sleep longer-term memory index (BERefRN—BERN) and the number of trials played in REM sleep (left), tonic REM sleep (middle), and phasic REM sleep (right) across participants. c Correlation between the NREM sleep longer-term memory index and the number of trials played in NREM sleep (NREM2 + NREM3, left), NREM3 (middle) and NREM2 (right) across participants. For b and c, Pearson’s correlation coefficients are displayed on each correlation plot (P < 0.05: *, NS: P ≥ 0.05). Open circles (c) show data points detected as outliers (see Methods). The correlation coefficients obtained when excluding these data points are presented in the Results section. Dotted lines show the linear fit for pairs of variables with significant correlation
