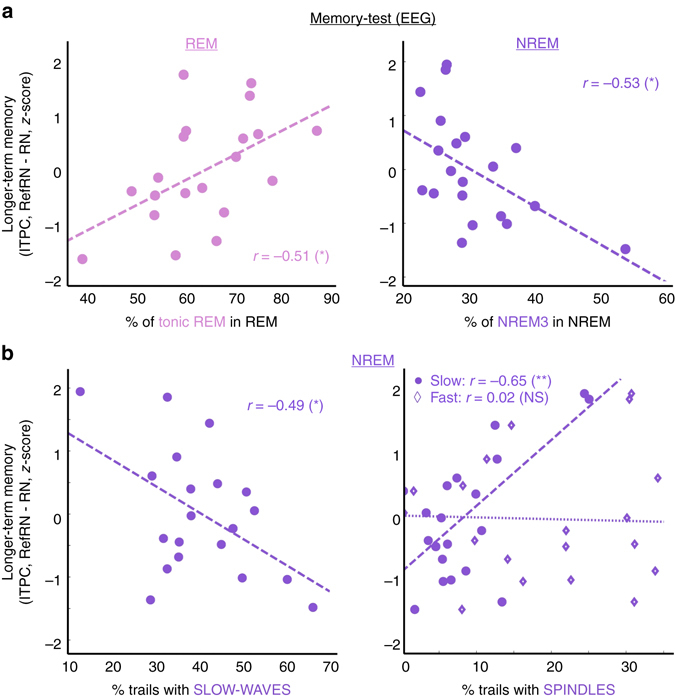
Fig. 6.

Impact of prior exposure and sleep rhythms on phase coherence upon awakening. EEG index (Inter-Trial Phase Coherence, ITPC) quantifying longer-term memory (ITPCRefRN—ITPCRN) for RefRN sounds heard during REM and NREM sleep, computed over the whole post-sleep blocks. a Left: Correlation between the magnitude of the REM sleep EEG index (z-scored across participants) and the proportion of trials in tonic REM sleep. Right: Correlation between the magnitude of the NREM sleep EEG index and the proportion of NREM3 trials within NREM sleep. As for the behavioral index (Fig. 3b), there was a positive correlation between REM sleep learning and the prevalence of tonic REM sleep. There was also a negative correlation between the marker of learning for the NREM list and the prevalence of NREM3 sleep. b Correlation between the magnitude of the EEG index (z-scored across participants) for the RefRN heard in NREM and the proportion of trials containing slow waves (left) or sleep spindles (right; circles: slow spindles; diamonds: fast spindles). Note the negative correlation between the EEG learning index and the proportion of trials associated to slow waves on one hand and the positive correlation with the proportion of trials associated with slow spindles on the other hand. Pearson’s correlation coefficients are displayed on each correlation plot (P < 0.01: **P < 0.05: *P ≥ 0.05, NS) and dotted lines show the linear fit between the pairs of variables
