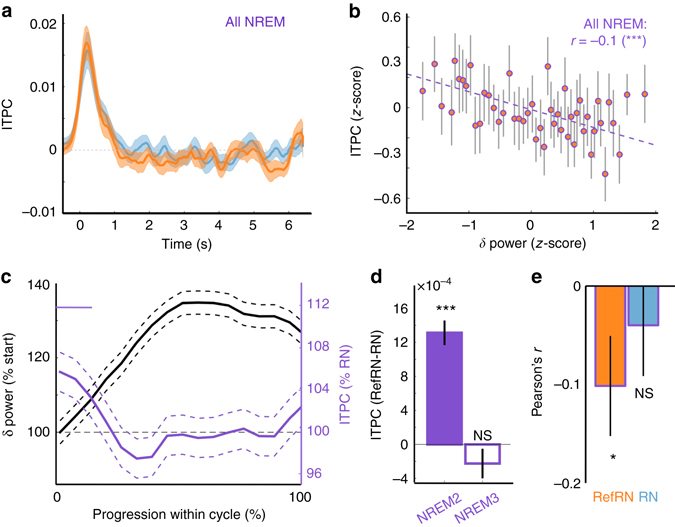
Fig. 7.

The learning index is dynamically correlated with slow-wave power in NREM sleep. a Inter-trial phase coherence (ITPC) extracted around 2 Hz ([1.5, 3.5]Hz) locked to stimulus onset for RefRN (orange curve) and RN (blue curve) trials in NREM sleep (NREM2 and NREM3). ITPC was corrected by the baseline ITPC ([−1.3, 0.3]s). b Correlation between ITPC values computed for RefRN trials (z-scored per sleep-cycle to highlight the within-cycle dynamics, see Methods) and δ (<5 Hz) power (N = 1368 data points in 82 cycles and 18 participants). Data was binned for illustrative purpose (N = 50 bins) and each dot represents a bin. Error bars represent the standard error of the mean (SEM) of ITPC values for each bin. Mixed-effects models revealed a significant influence of δ -power on ITPC (see Methods) quantified here with a Pearson’s correlation coefficient (***P < 0.001) as well as the regression line between the two variables, both estimated on unbinned data. c Evolution of longer-term memory index (ITPC, RefRN over RN ratio) and δ -power within sleep cycles. Cycle durations were normalized and expressed as a percentage of total duration. δ -power was also normalized (100% = beginning of cycle). Dotted curves denote the SEM across sleep cycles (N = 82 in 18 participants). Note the perceptual learning (RefRN>RN, P cluster<0.05) at the beginning of sleep cycles (typically light NREM). This advantage disappeared with the increase in δ -power. d Difference in ITPC between RefRN and RN (longer-term memory index) in NREM2 and NREM3 (all sleep recordings aggregated: N = 3698 and 2480 data points for NREM2 and NREM3, respectively, in 20 participants). The number of data points being different for RefRN and RN trials, the mean ITPC value for RN trials was subtracted to the ITPC for RefRN (unpaired subtraction). Mixed-effects models revealed a significant interaction between sleep stages and stimulus condition (χ 2(5) = 432.0, P < 2.2 × 10⁻¹⁶, see Methods). Stars show post hoc statistical tests comparing ITPC for RefRN and RN trials in NREM2 (two-tailed t-tests: ***P < 0.001) and NREM3 (NS: P≥0.05). e Pearson’s correlation coefficients between ITPC and δ -power for RefRN (orange) and RN (blue), respectively, computed on each cycle separately and averaged here across sleep cycles (n = 82 cycles). Pearson’s coefficients were significantly negative for RefRN (two-tailed t-test, t(81) = −2.24, P = 0.028, Hedges’ g = 0.25) but not for RN trials (t(81 = −0.50, P = 0.62, Hedges’ g = 0.06)
