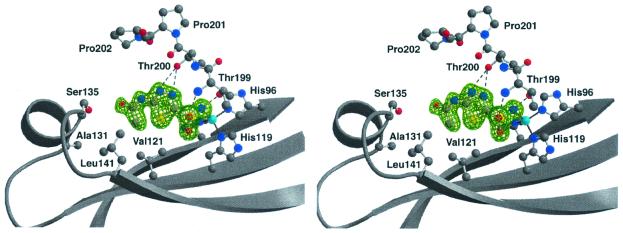
Figure 5.
Electron density map of the CA XII-acetazolamide complex generated with Fourier coefficients |Fo| − |Fc| and phases calculated from the final model less the atoms of acetazolamide (3σ contour). Atoms are colored as in Fig. 4. The 130's segment is in the α-helix on the left.

